
FIGURE 1.
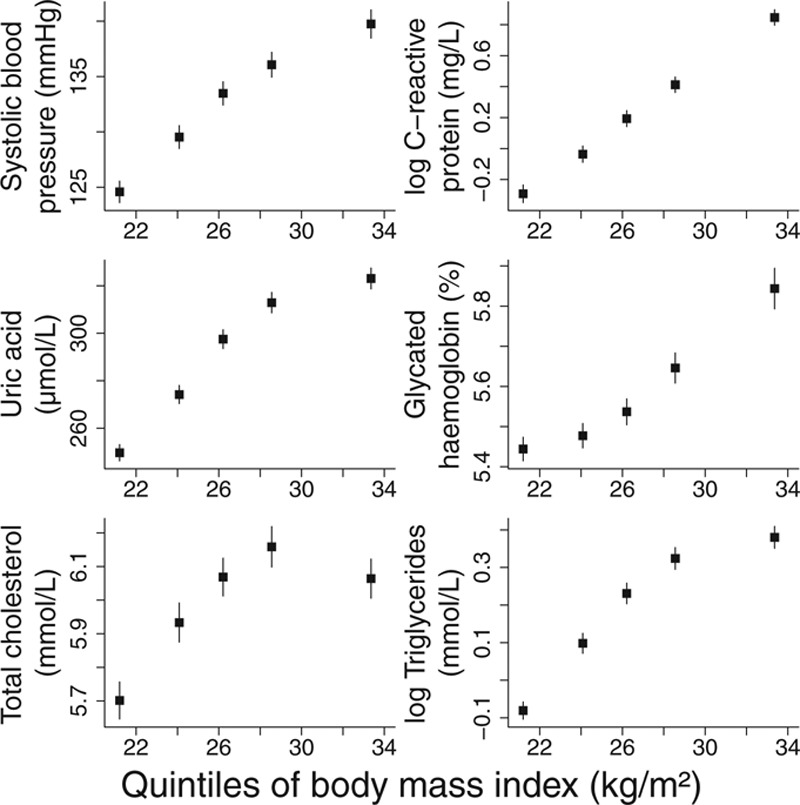
Mean level of cardiovascular risk factors stratified by quintile of body mass index against mean value of body mass index in quintile (lines are ±1.96 standard errors).
Official websites use .gov
A
.gov website belongs to an official
government organization in the United States.
Secure .gov websites use HTTPS
A lock (
) or https:// means you've safely
connected to the .gov website. Share sensitive
information only on official, secure websites.
Mean level of cardiovascular risk factors stratified by quintile of body mass index against mean value of body mass index in quintile (lines are ±1.96 standard errors).