
FIGURE 3.
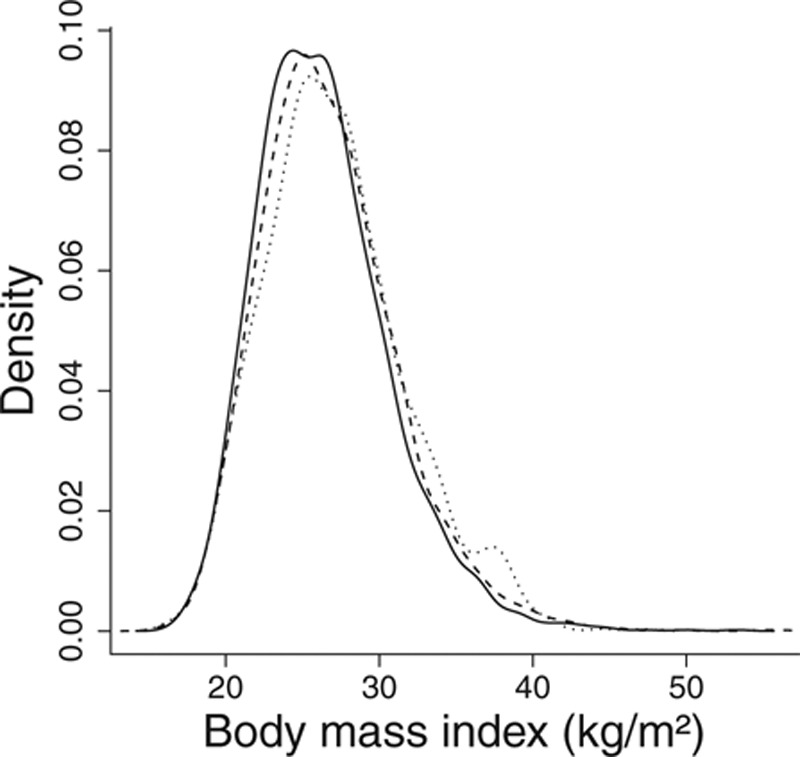
Distribution of body mass index in subgroups defined by genetic variant rs1421085: solid line, major homozygotes; dashed line, heterozygotes; dotted line, minor homozygotes. Densities are smoothed using a kernel-density method with a common bandwidth of 0.8.