
FIGURE 6.
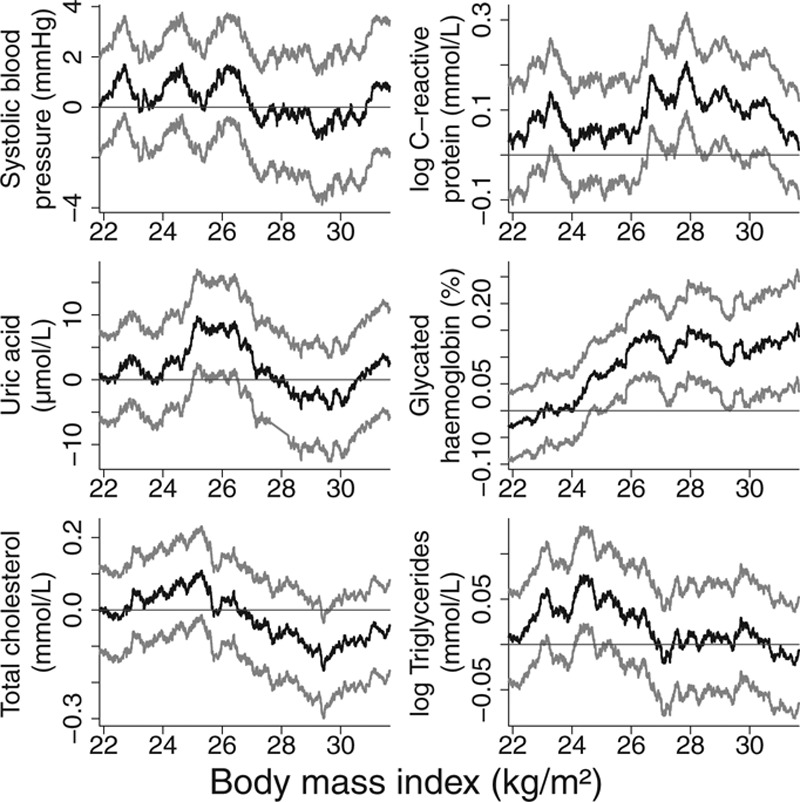
Localized average causal effect estimates of body mass index on cardiovascular risk factors at various levels of body mass index from EPIC-InterAct data set: sliding window approach with window size 2,000. Gray lines represent point wise 95% CIs.