
Figure 4.
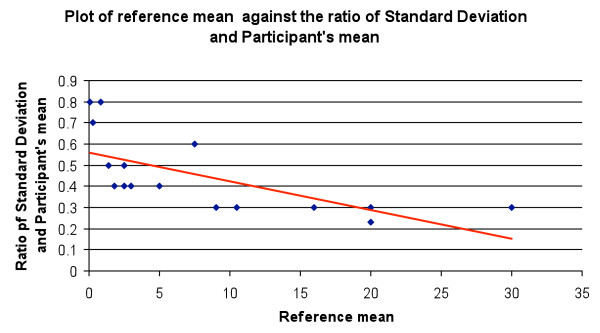
Plot of the reference mean parasitaemia against the ratio of the standard deviation and participants' mean. (Blue dot: ratio of SD and mean, Red line: trend line).
Official websites use .gov
A
.gov website belongs to an official
government organization in the United States.
Secure .gov websites use HTTPS
A lock (
) or https:// means you've safely
connected to the .gov website. Share sensitive
information only on official, secure websites.
Plot of the reference mean parasitaemia against the ratio of the standard deviation and participants' mean. (Blue dot: ratio of SD and mean, Red line: trend line).