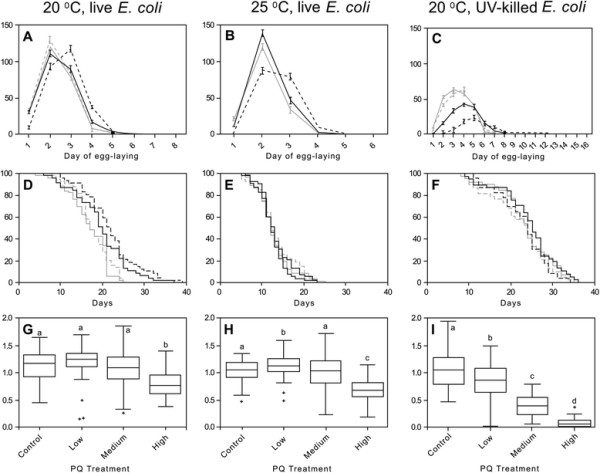
Figure 2.

Summary of phenotypic data forC. elegansin each life-history assay. Assay conditions are shown at the top. A-C show daily reproductive schedules for nematodes in each treatment (solid and dashed gray lines = Control and Low PQ treatments, and black solid and dashed lines = Medium and High PQ treatments, respectively). Note the change in x-axis range for panel C. D-E show mean survival curves for each treatment. G-H report fitness levels for each treatment with horizontal lines = median fitness, boxes = upper and lower quartiles, and error bars = range of values, and letters above each box show groups statistically indistinguishable in post-hoc comparisons. See Additional file 1: Tables S1-S3 for final sample sizes for each assay and PQ treatment group.
