
Figure 5.
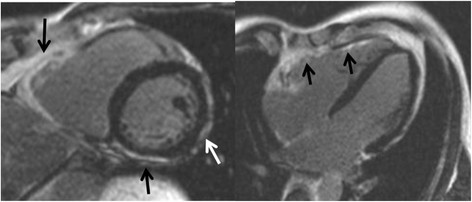
Right ventricular late gadolinium enhancement in ARVC. The short axis image (left) shows LGE in the RV as well as the LV (black arrows). The lateral wall of the LV shows thinning due to fatty replacement that was confirmed on T1-weighted images. The long axis view (right) shows diffuse LGE involving the free wall of the RV.