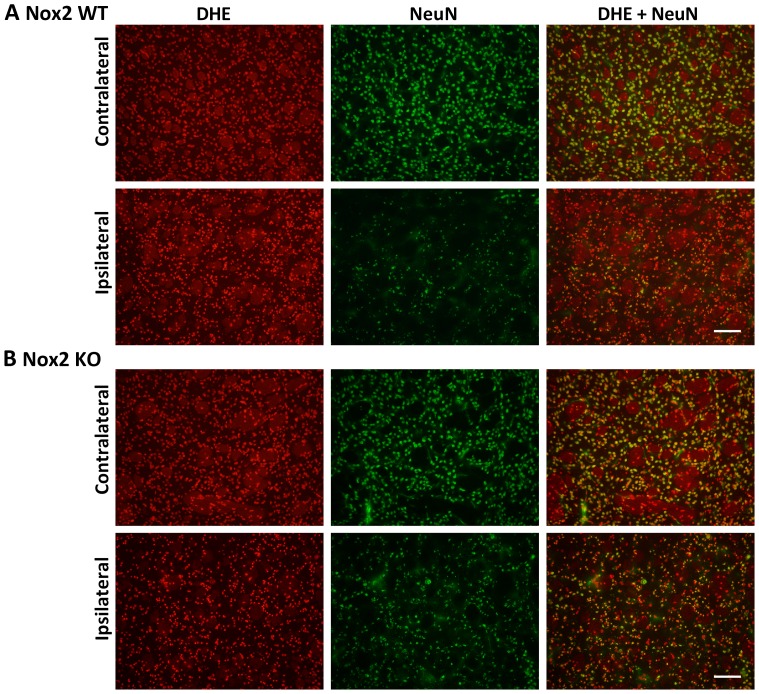
Figure 3. Immunofluorescent co-localisation of ROS generation with NeuN at 24 h.
Representative fluorescent micrographs of ROS-sensitive DHE, the neuronal antibody NeuN and merged images from the contralateral and ipsilateral core striatum of Nox2 WT (A) and Nox2 KO (B) mice at 24 h post-stroke. Scale bars = 50 µm.

