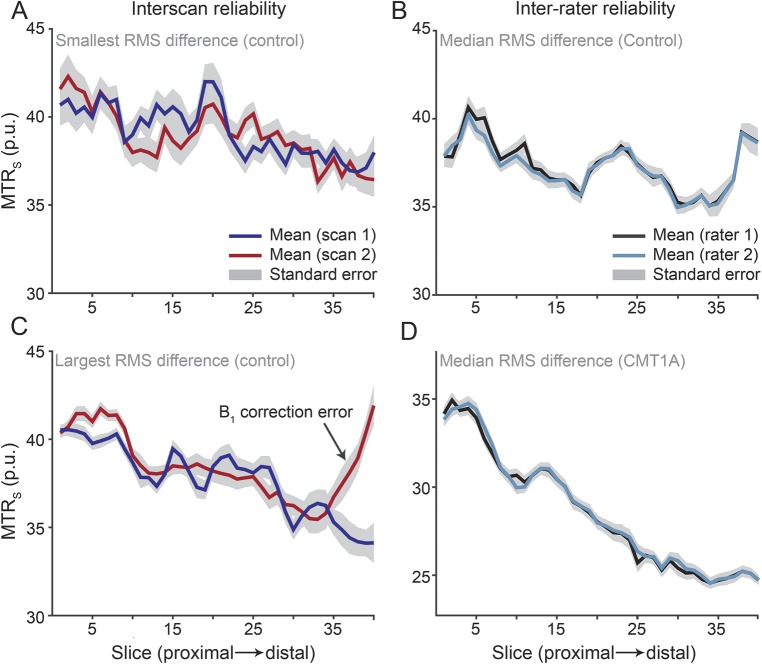
Figure 4. Representative interscan and inter-rater data.
Representative interscan and inter-rater magnetization transfer ratio values calculated for each slice (MTRs). For the interscan data, the control subjects with the smallest (A) and largest (C) root mean squared (RMS) difference across scans are given. The mean values across scans (red and dark blue lines) were repeatable at the slicewise (MTRs) and volumetric levels (magnetization transfer ratio values calculated across the entire volume [MTRv]); however, differences were observed in distal slices in a few subjects (see the MTR overcorrection in C, which is most likely due to artifacts in this subject's B1 map). For the inter-rater data, the control (B) and patient (D) with the median RMS difference are given. In all cases, the mean values across raters (black and light blue lines) were highly repeatable.

