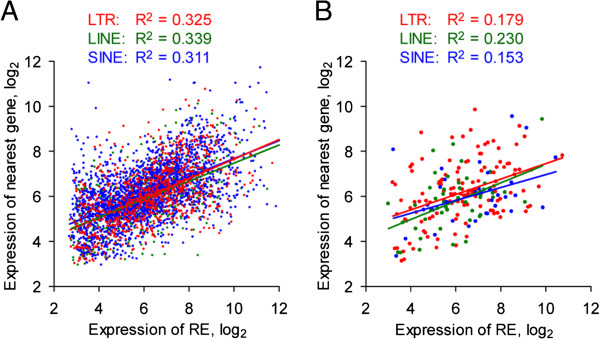
Figure 2.

Linkage of RE expression to activity of the nearest gene. Regression of RE-reporting probe values for heart tissue samples against the one-step Tukey’s biweight w-estimator value calculated for all probes corresponding to all probesets for the nearest 5′ or 3′ gene, omitting points where the nearest gene was not present on the microarray platform. (A) All RE-reporting probes, as identified using previously published methodologies, and (B) RE-reporting probes passing enhanced filtering, that were significantly regulated between B6 tissues for three independent experiments using the Mouse Genome 430 v2 microarray platform (p < 0.001 by ANOVA comparing tissues and eliminating experiment). Data are obtained from E-GEOD-1986, −9954, and −10246.
