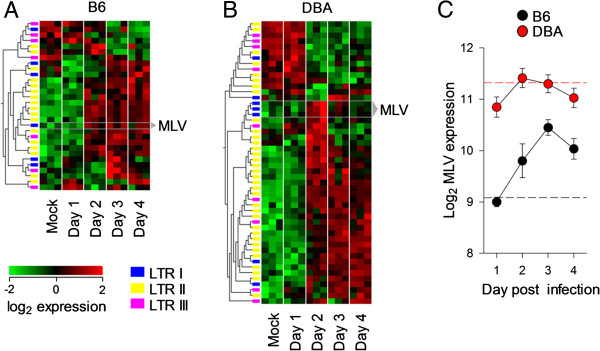
Figure 6.

RE expression in a murine influenza A model. Heatmaps of significantly regulated RE-reporting probes during the first days of mouse influenza A infection (p < 0.01 by ANOVA comparing time point), for lung samples from B6 (A) and DBA2 (B) strains. Data are obtained from E-MTAB-835, a Mouse Genome 430 v2 array. Probes are hierarchally-clustered, whereas samples are ordered by time point. Probes reporting MLV expression are highlighted. (C) Median (±SEM) expression of MLV-reporting probes across all mice at each time point for B6 and DBA2 strains over the four days of the experiment. Hashed lines indicate the median of the mock-infected controls for B6 (black) and DBA2 (red).
