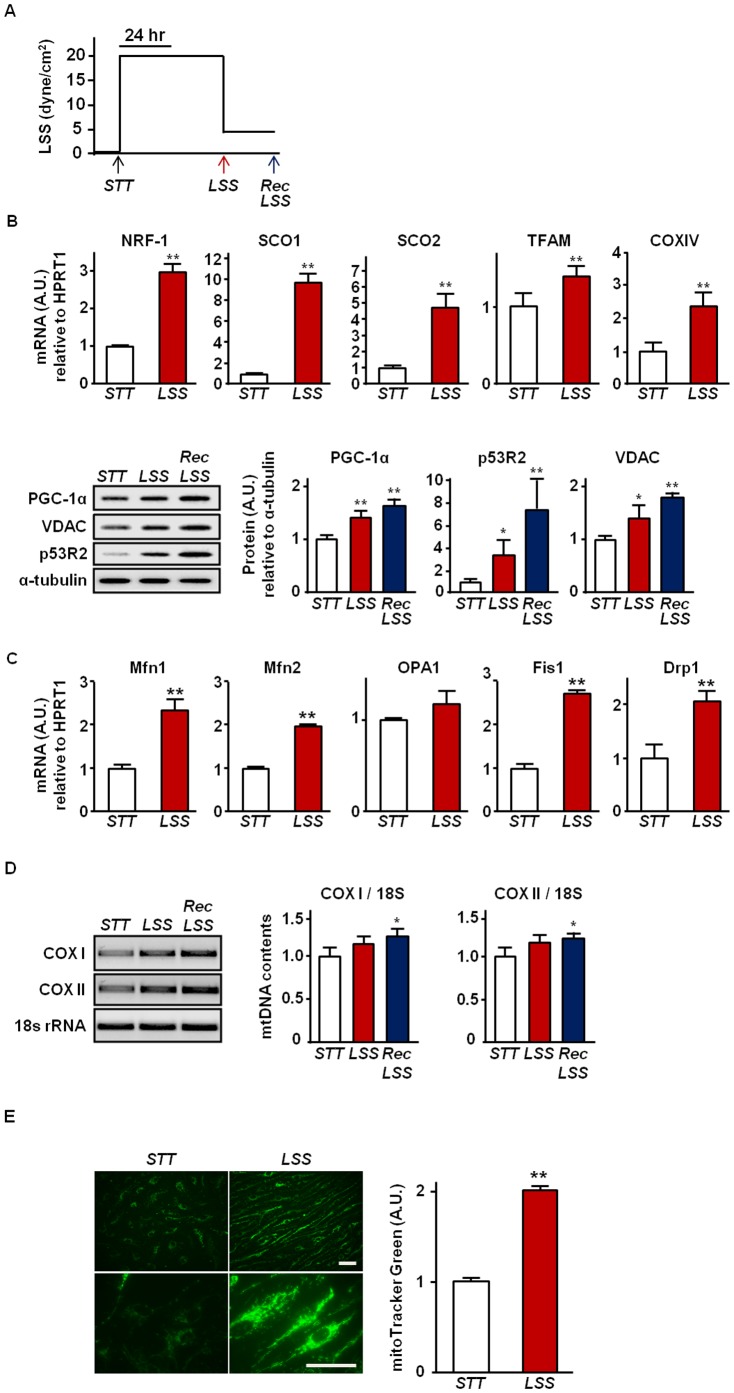
Figure 1. Increased mitochondrial biogenesis markers by LSS in HAECs.
(a) An overview of LSS protocol used. HAECs were exposed to exercise-mimicking LSS at 20 dyne/cm2 for 48 hrs, and then, recovery (Rec) LSS at 5 dyne/cm2 was followed for another 24 hrs. (b) Effect of LSS on the mRNA and protein expression of mitochondrial biogenesis markers. mRNA expression of NRF-1, SCO1, SCO2, TFAM, and COX IV were assessed by real-time PCR and protein contents of PGC-1α, VDAC, and p53R2 were analyzed by western blot. (c) Effect of LSS on the mRNA expression of mitochondrial dynamics markers. mRNA expression of Mfn1, Mfn2, OPA1, Fis1, and Drp1 were assessed by real-time PCR. (d) Effect of LSS on mtDNA contents. Relative mtDNA contents are expressed as a ratio of COX I and II to 18s rRNA. (e) Effect of LSS on mitochondrial mass. Mitochondria were labeled with MitoTracker Green in live HAECs. Representative fluorescence micrographs under STT (left panel) and after 48 hrs of LSS at 20 dyne/cm2 (right panel) are shown. Bar = 50 µm. The MitoTracker Green fluorescence intensities were analyzed using the Image J (NIH) software. All densitometry analyses values are shown as mean ± SE; * P<0.05 vs. STT; ** P<0.01 vs. STT.

