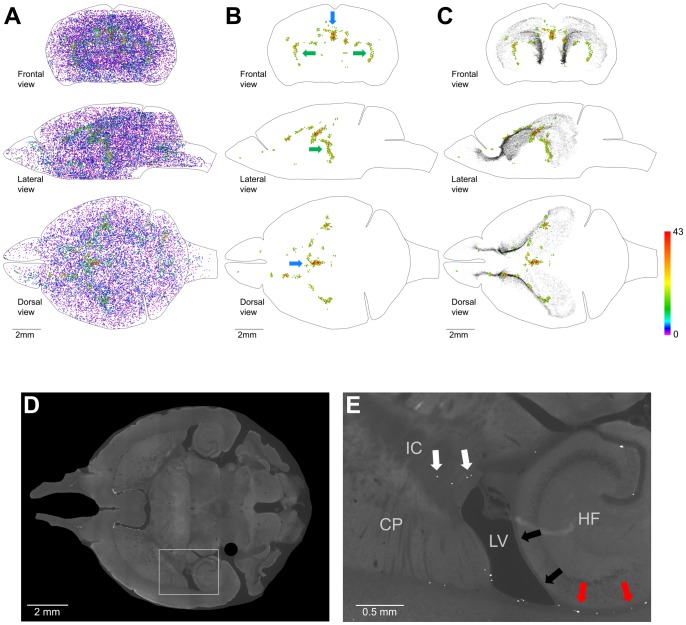
Figure 11. Distribution of proliferating cells outside of the Main Proliferative Zone (MPZ) and the dentate gyrus of the hippocampus (DG).
A–C. Volume number density of proliferating cells. Each EdU-labeled nucleus is shown as a colored dot with colors assigned according to the number of neighboring EdU-labeled nuclei located closer than 200 µm to this nucleus. Scale is shown on the right. A. All EdU-labeled nuclei located outside of the MPZ and DG. B, C. 600 EdU-labeled nuclei that have 16 or more neighboring EdU-labeled nuclei located closer than 200 µm. EdU-labeled nuclei in the MPZ and DG are shown as black dots of smaller size (C). The brain shape is outlined with a black line. Frontal, lateral, and dorsal views of the brain are shown. D, E. Proliferating cells in the inner capsule are shown with white arrows (E). The presence of proliferating cells in places where the alveus is in contact with a layer of white matter formed by bundles connecting the thalamus with the cortex is shown with red arrows and the absence in places where no such contact with black arrows (E). The position of the images shown on panel E is indicated on panel D with the white rectangle. Caudoputamen (CP), Hippocampal Formation (HF), Lateral Ventricles (LV), Inner Capsule (IC). 120 days-old mouse one hour post EdU injection.

