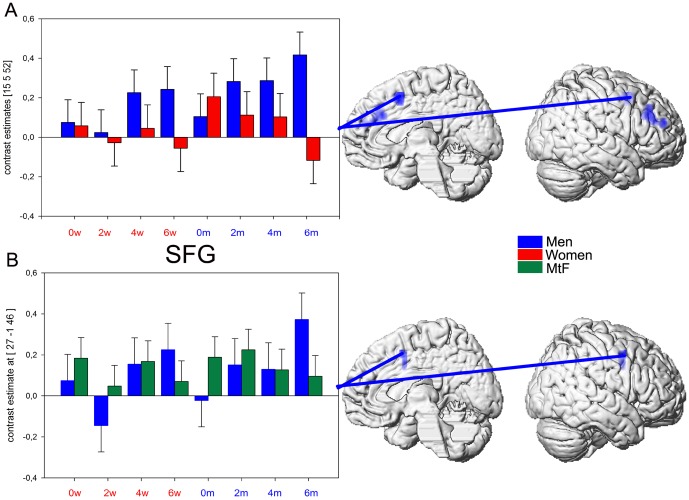
Figure 3. Graduate voice gender morphing.
A. Contrast estimates of stronger activation in men as compared to women (blue) in the right SFG (peak voxel 15 5 52) for increasing morphing degree plotted for all 8 conditions. B. Contrast estimates of stronger activation in men as compared to MtFs (blue) in the right SFG (peak voxel 27 −1 46) for increasing morphing degree plotted for all 8 conditions (p<0.05 Monte Carlo corrected, extent threshold = 20 voxels).

