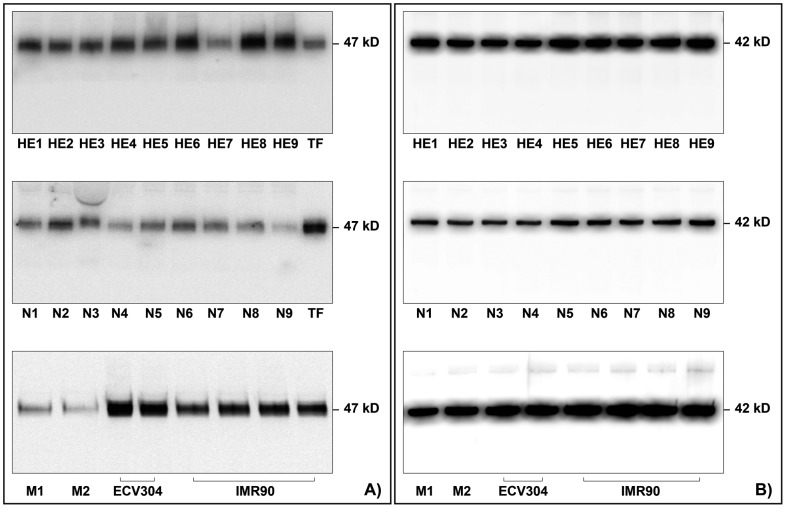
Figure 3. Panel A shows the western blot analysis of tissue factor (TF) in homogenate samples of purified eosinophils from 9 patients with hyperosinophilic conditions (HE) (top), purified eosinophils from 9 normal controls (N) (middle), and purified monocytes from 2 normal controls (M), purified endothelial cells from 2 samples of cell line ECV304 and purified fibroblasts from 4 samples of cell line IMR90 (bottom).
A major band with Mr of 47,000 corresponding to the native TF was found in the eosinophil homogenates from the 9 patients and the 9 controls, with a higher intensity in the former than in the latter. The intensity of the TF band was weaker in monocytes (M1, M2) than in endothelial cells (ECV304) and in fibroblasts (IMR90). Panel B shows the western blot analysis of the ubiquitary protein beta-actin, which was well represented in all patients, normal subjects and positive controls.

