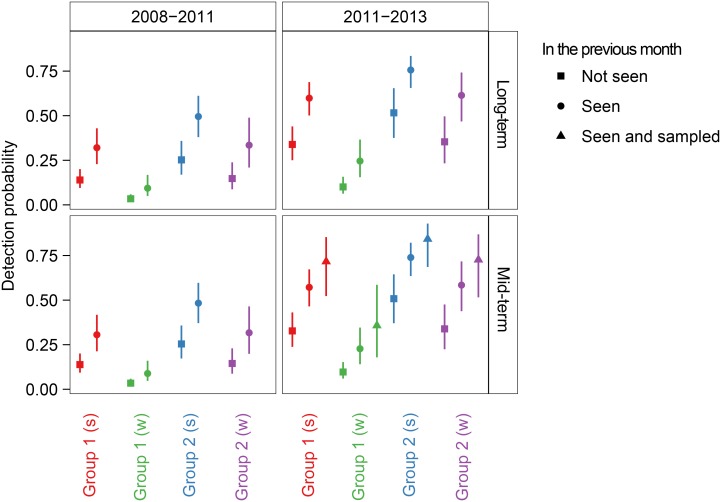
Figure 6. Detection probability of killer whales at Marion Island, given their capture history in the previous month.
Detection probability (±95% confidence interval) was estimated using the highest ranked (lowest QAICc) capture-recapture model in which sampling effect was assumed to be mid-term (1 month). Sampling effect was not in the highest ranked long-term (<24 months) model. The two time periods (2008–2011 and 2011–2013) correspond to different intensities of field effort; we only sampled in 2011–2013. ‘Groups’ refer to two classes of animals with distinct probabilities of detection (mixture components); s refers to the summer peak in killer whale abundance, w to the winter.

