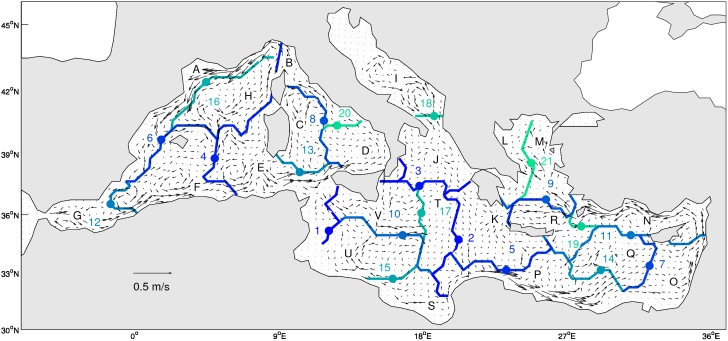
Figure 4. Map of the 21 clusters boundaries obtained from clustering of the oceanographic distance matrix OD3depths using the flexible link.
Each boundary is colored and numbered according to the cut-off distance on the dendrogram (from blue – high distance- to green- low distance). Each region is identified by a letter from A to V. The velocity from the circulation model, averaged for the 4-year (2007–2010) and the 3 depths is overlaid as black vectors.

