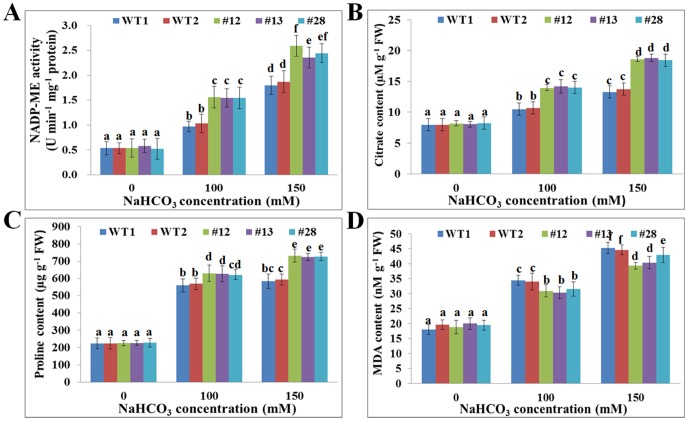
Figure 5. GsTIFY10a overexpression altered several physiological indices of transgenic plants under alkaline stress.
a. The NADP-ME activity of WT and transgenic lines. b. The citric acid content of WT and transgenic lines. c. The free proline content of WT and transgenic lines. d. The MDA content of WT and transgenic lines. Thirty plants of each line were used for each experiment. Data are means (±SE) of three replicates. Significant differences were determined by one-way ANOVA (P<0.0001) statistical analysis. Different letters show significant differences between groups as indicated by Dunnett's posttests (P<0.05).

