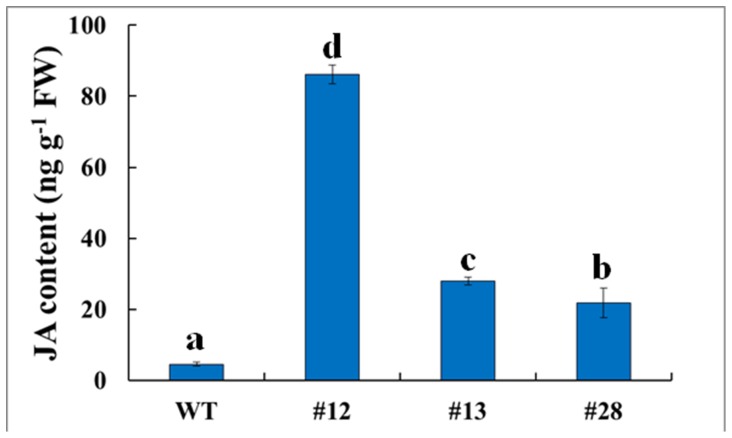
Figure 7. Increased JA content in GsTIFY10a transgenic plants. Leaves of WT and transgenic plants were harvested for JA extraction, and subjected for HPLC analysis to determine the content of endogenous JA.
Each data point represents the mean (±SE) of three samples from independent sets of plants. Significant differences were found using one-way ANOVA analysis (P = 1.07*10−9).

