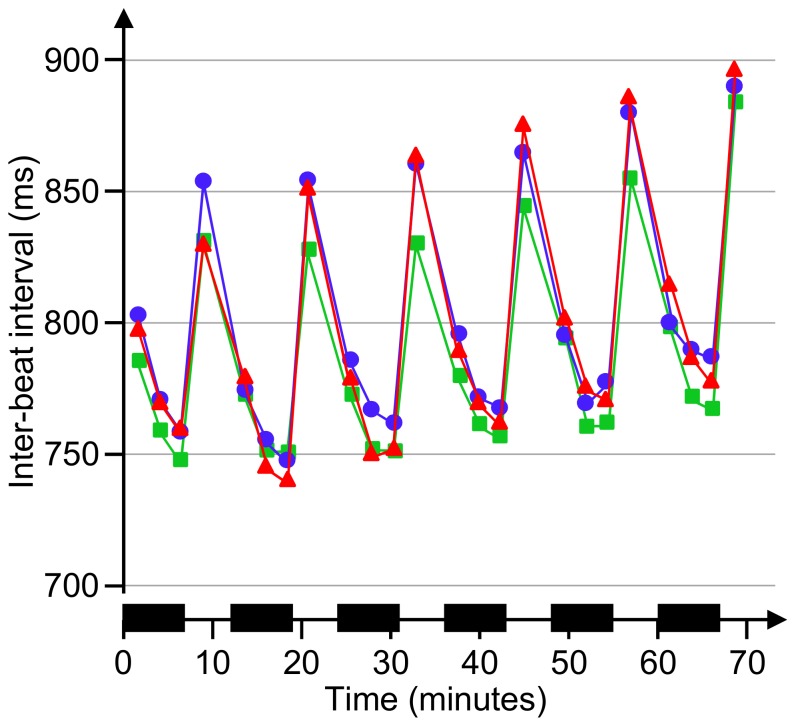
Figure 3. Heart rate during the work period.
Heart rate (measured by inter-beat ECG intervals) during work and breaks in the easy (MT1, green squares), medium (MT2, blue circles), and difficult (MT3, red triangles) mental task protocols. X-axis shows time after commencing work; black zones mark physical work bouts.

