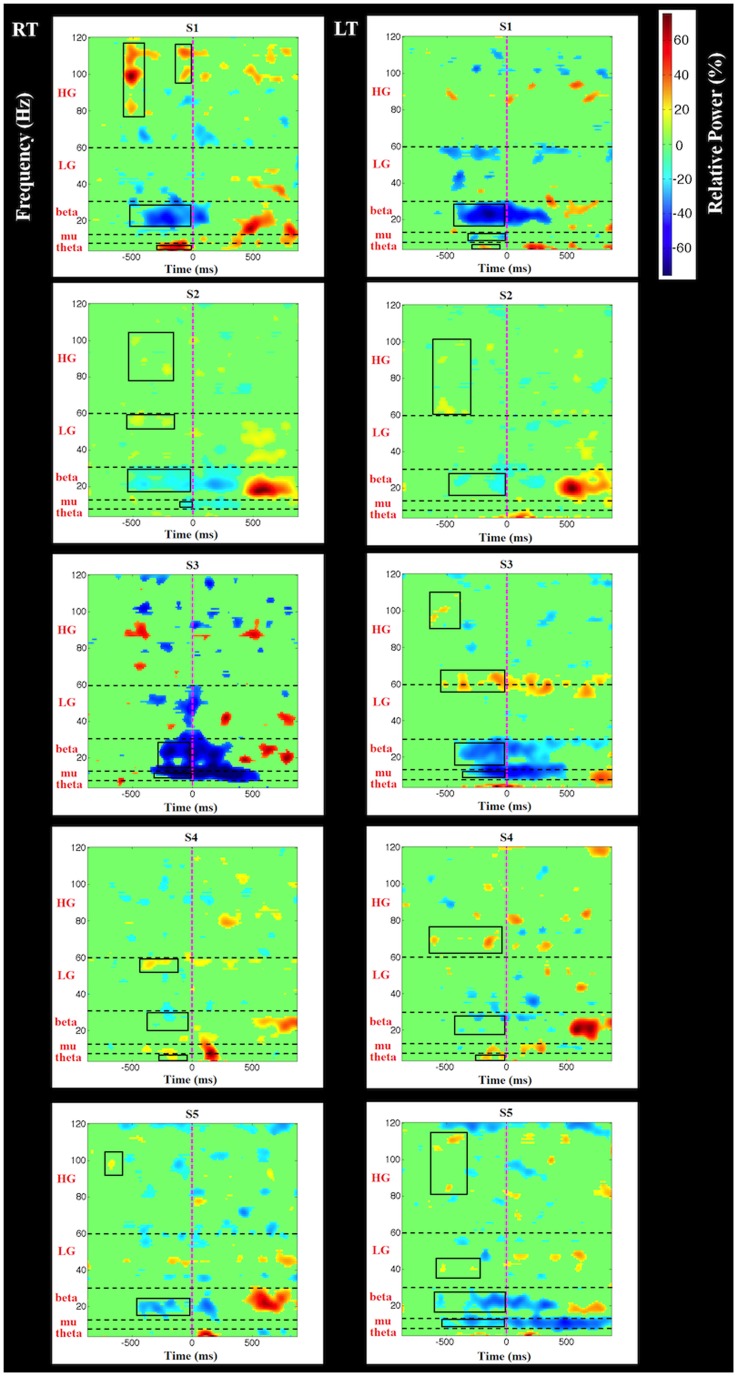
Figure 3. Subject specific time-frequency plots for left and right thumb movements.
Data represent thresholded (top 10%) relative power changes (blue = decrease, red = increase, and light green = no significant change) at contralateral EEG channels (C3/C4). Time frequency maps aligned at time = 0 ms (pink dashed line). Horizontal dash lines represent frequency band boundaries. Boxes represent ERD/ERS changes that are not artifactual (see text).

