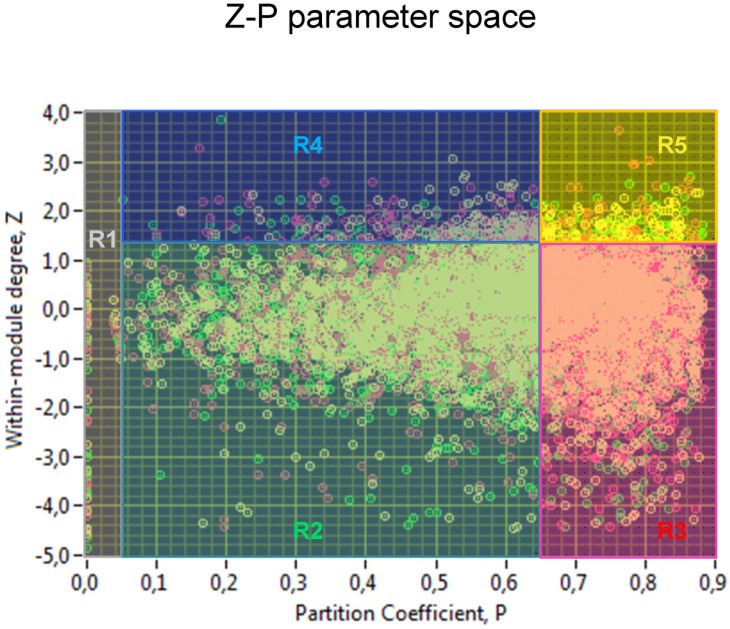
Figure 6. Z-P parameter space with corresponding roles for all kissing couples.
Scatterplot of Z-P parameter space characterized by the participation coefficient P (X-axis) and the within-module degree Z (Y-axis) representing all kissing couples under the three kissing conditions. Roles with corresponding regions: R1 (Pi≤0.05) – ultra-peripheral nodes; R2 (Zi<1.4; 0.05<Pi<0.65) – non-hub peripheral nodes; R3 (Zi<1.4; 0.65<Pi<0.9) – non-hub connector nodes; R4 (Zi>1.4; 0.05<Pi<0.65) – hub peripheral nodes; R5 (Zi>1.4; 0.65<Pi<0.9) – hub connector nodes. RK: yellow circles; K-SA: red circles; and HK: green circles.

