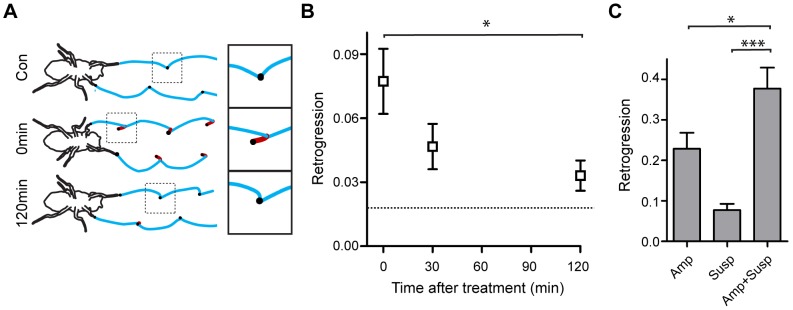
Figure 3. Effects of suspension on fly walking.

A. Trajectory of leg motions (blue lines) in unperturbed flies (Con). Black dots are touchdowns. Immediately after suspension (“0 min”), the legs retrogress (red line). After 2 hours (120 min) retrogression is reduced. B. Backtracking at different times after release from suspension. Note that the initial retrogression gradually subsides. Dotted line represents retrogression in Con. n = 12. * p<0.05, One way repeated measures ANOVA with post-hoc Dunnett multiple comparison test. C. The effects of suspension and amputation are additive. The effect of suspension (Susp), amputation(Amp) and their combination (Susp+Amp) was defined as the difference between the initial (0 min) and the final (120 min) values. n = 12–17. p<0.0001, Kruskal-Wallis test. * p<0.05 *** p<0.001, Mann-Whitney test with bonferroni correction of p values. Error bars are mean ±SEM.
