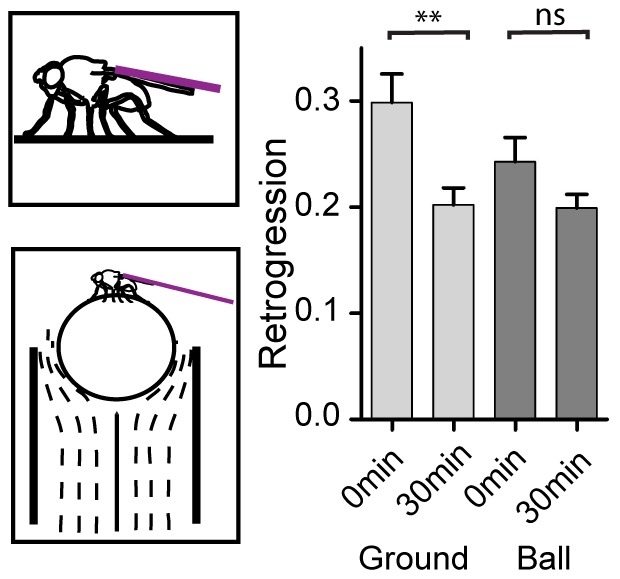
Figure 5. Effects of suspension method on the stress response.

Top-left, schematic illustrates immobilization of fly by pin (purple line) while the fly is allowed contact with a flat surface. Bottom-left, schematic illustrates immobilization of fly by pin while fly is allowed to walk on a polypropylene ball suspended over a flow of air. Right, comparison of retrogression at 0 min and 30 min of recovery after 2 hours of immobilization with surface contact (red bars, top left schematic) or with treadball contact (blue bars, bottom left schematic). n = 23. ** p<0.01, Wilcoxon signed rank test. Error bars are mean ±SEM.
