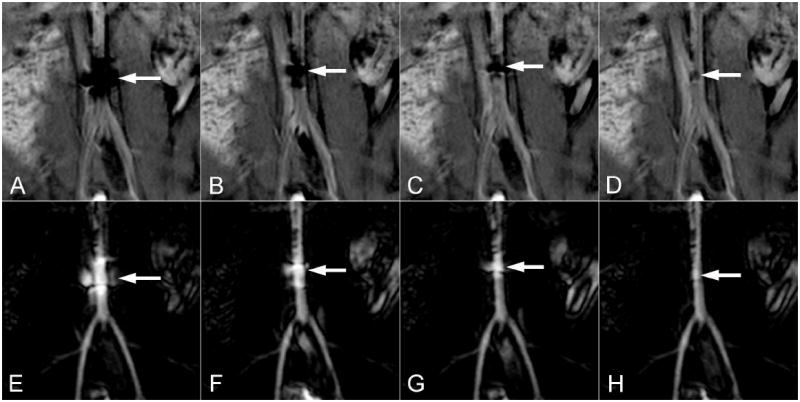
Figure 4.

The effect of several MARC catheter current levels are demonstrated on the source (top row) and roadmapping (bottom row) images. Current levels of 300mA (A,E), 100mA (B,F), 50mA (C,G) and 10mA (D,H) are demonstrated in the distal aorta of a swine. The spatial extent of the artifact on the source images (top row arrows) scales with current and is still evident at very low current levels. The corresponding signal increase on the roadmap images (bottom row arrows) similarly localizes the catheter tip even at very low current levels.
