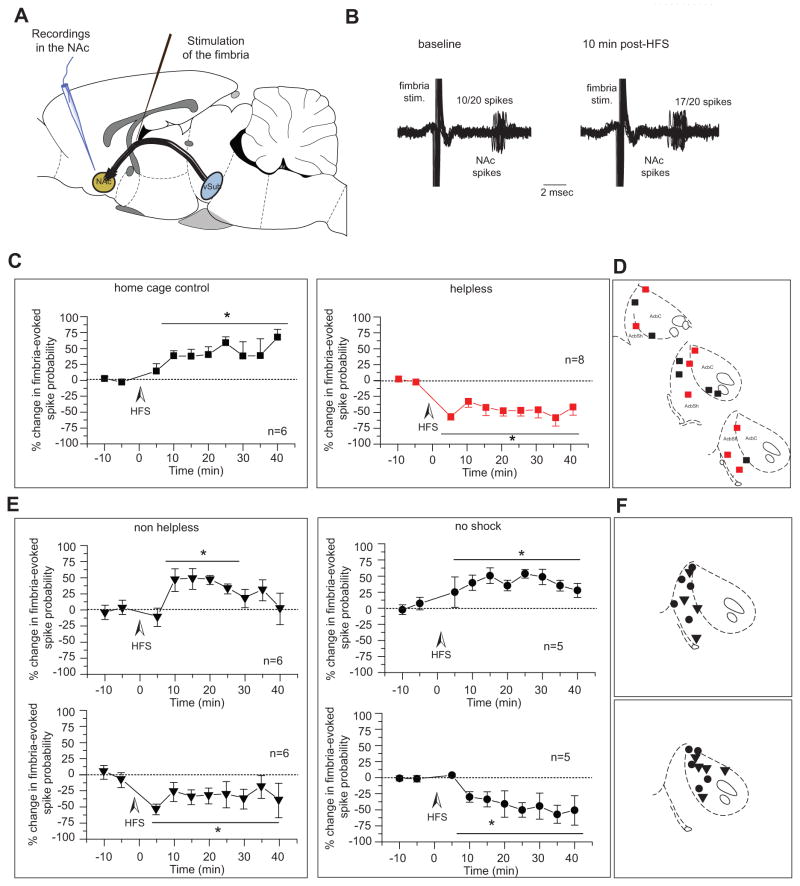
Figure 4. Shell and core segments of the nucleus accumbens show different responses to HFS of fimbria in helpless vs non-helpless rats.
A) Schematic of recording and stimulating electrode placements. B) Extracellular recording trace showing a representative example of the increased fimbria-evoked spike probability recorded from a NAc neuron in a control animal, 10 min after high frequency stimulation. Twenty overlaid consecutive traces are shown with the numbers demonstrating the number of evoked spikes for 20 stimulations. c) HFS of the fimbria produced LTP in control rats (black squares) but produced LTD in helpless rats (red squares). D) Recording electrode placements in the NAc of home cage control (black squares) and helpless rats (red squares) animals shown as coronal sections of the rat brain, taken from Paxinos and Watson (53). E) HFS of the fimbria produced LTP in the accumbens shell in non-helpless and no-shock rats (top) but produced LTD in the accumbens core (bottom). Plots show mean percent change (± SEM) in fimbria-evoked spike probability, normalized to the baseline. F) Recording electrode placements in the NAc of non-helpless (triangles) and helpless rats (circles) animals, shown as coronal sections of the rat brain, taken from Paxinos and Watson (53).
*p<0.05; ***p<0.001; arrow indicates the time of stimulation
vSub: ventral subiculum of the hippocampus; NAc: nucleus accumbens; HFS: high-frequency stimulation

