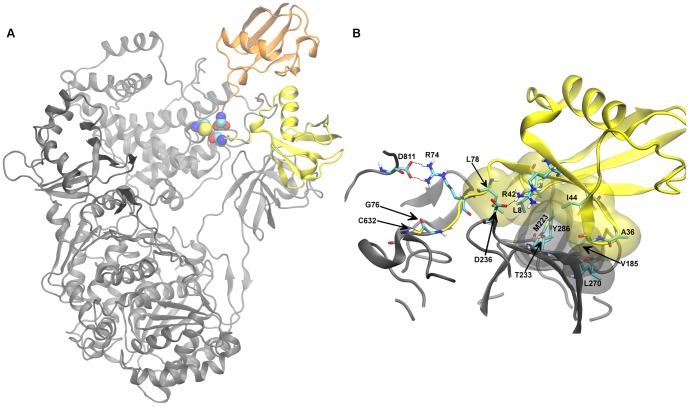
Figure 2. Model of hUbA1-Ub(T) complex.
A) Comparison of the best two binding modes of Ub resulting from HADDOCK calculation, Ha and Hb, shown in yellow and orange, respectively. Terminal Ub-Gly76 and catalytic UbA1-Cys632 are highlighted in spheres coloured by atom type. B) Detail of hUbA1∼Ub(T) interactions in the lowest energy MD frame (time 9.6 ns). Apolar hydrogens were omitted for sake of clarity. Colour code: hUbA1, grey; Ub(T), yellow; van der Waals interactions are highlighted with transparent Connolly surfaces. Carbons are in cyan, nitrogen in blue, oxygens in red, sulphur in yellow and hydrogens in white.

