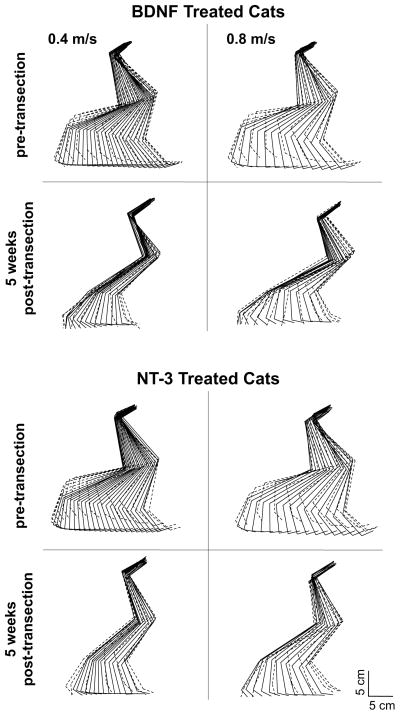
Figure 2.
“Stick-diagram” representations of the pre- and post-transection (5 weeks) hindlimb kinematics for one step of a representative cat from both groups (NT-3 and BDNF) at 2 different treadmill speeds: 0.4 and 0.8 m/s. The position of the hindlimb is presented as stick figures throughout the step cycle at 30 ms intervals. Both cats showed similar stepping characteristics with good plantar weight-bearing stepping at all the speed tested but with reduced swing length and height. Solid lines: Stance portion of the step; dashed lines: Swing portion of the step.

