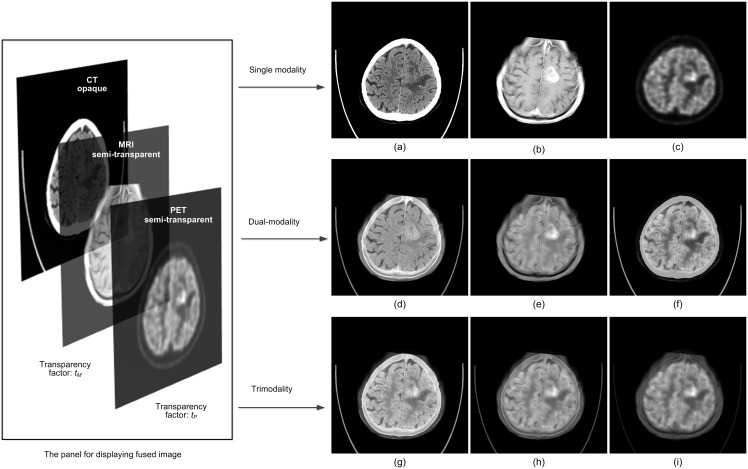
Figure 2. A glioma tumor shown on CT, MRI, and PET images with various tP and tM altering in the range of 0 to 1 for patient 1.
(a) tP = 0, tM = 0; (b) tP = 0, tM = 1;(c) tP = 1, tM = 0; (d) tP = 0, tM = 0.5; (e) tP = 0.5, tM = 1;(f) tP = 0.5, tM = 0; (g) tP = 0.3, tM = 0.3; (h) tP = 0.5, tM = 0.5; (i) tP = 0.7, tM = 0.7.

