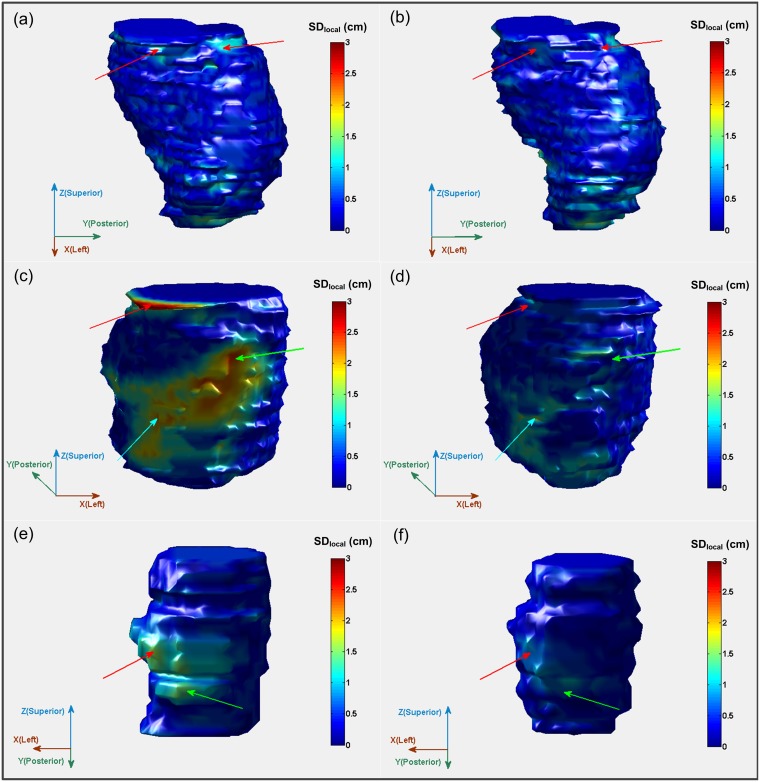
Figure 3. Comparison of the local standard deviation (SDlocal) mapped onto the median surface of GTVs with dual-modality fusion (a, c, e) and GTVs with tri-modality fusion (b, d, f) in color wash (from blue [SDlocal≤0.1 cm] to red [SDlocal≥3 cm]).
Red arrows in (a) and (b) point to the same region where SDlocal is partly reduced with the second scheme for patient 1. Red, green and light blue arrows in (c) and (d) point to the same regions of three quadrants where SDlocal is largely reduced with the second scheme for patient 2 (ΔSDlocal≥0.2 cm). Red and green arrows in (e) and (f) point to the same regions of two quadrants where SDlocal is largely reduced with the second scheme for patient 3 (ΔSDlocal≥0.2 cm in the area pointed by red arrows).

