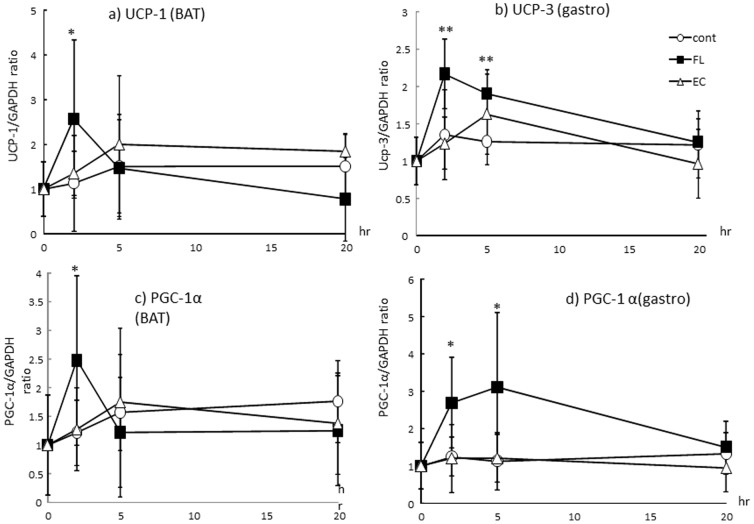
Figure 2. mRNA expression of UCPs and PGC1-αin BAT (a, b) or gastrocnemius (c, d) after administration of FL or EC.
The animals were euthanized 2, 5, and 20 hr after administration of the vehicle (Cont, n = 8), 10 mg/kg FL (n = 8), or 10 mg/kg EC (n = 8). Values represent the mean ± standard deviation. Statistical analyses were performed by Dunnett's post-test. Significantly different from vehicle, *p<0.05, **p<0.01.

