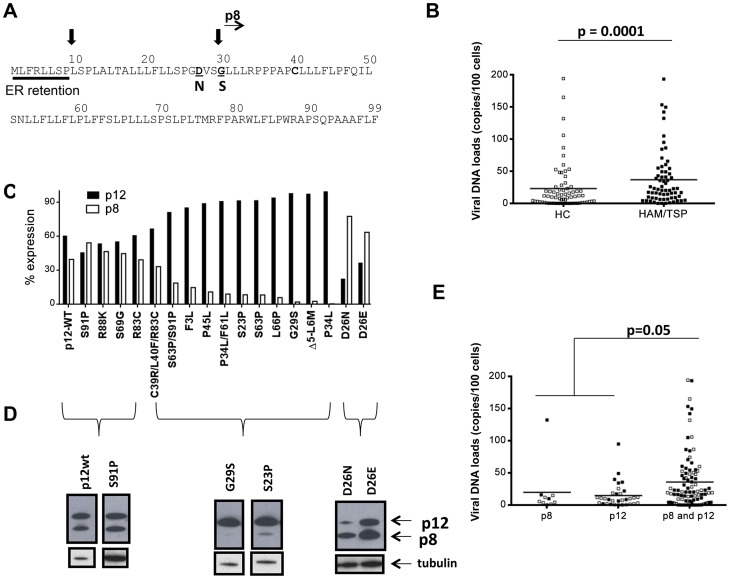
Figure 1. Analysis of orf-I from the PBMCs of HTLV-1 infected individuals.
(A) Schematic diagram of the Orf-I protein. The non-canonical endoplasmic reticulum (ER) retention sequence is underlined by a solid bar. Black arrows indicate the putative cleavage sites, as well as the start of the p8 isoform. Mutations which identify cleavage variants at position 26 and 29 are indicated in bold below the sequence. (B) Comparison of viral DNA levels in PBMCs from HTLV-1 infected individuals by disease association, HC: healthy carrier (open symbols) and HAM/TSP: HTLV-1 associated myelopathy/tropical spastic paraparesis (filled symbols). The data from 70 healthy carriers (HC) (n = 70) and 66 HAM/TSP individuals (n = 66) were analyzed using the Mann-Whitney Test stratified by disease status. The statistically significant difference is marked with the p value. The horizontal lines represent the mean viral DNA load. (C) Cloned orf-I cDNA constructs were transfected into 293T-cells and protein expression analyzed 48 hours after transfection. The density of p12 and p8 bands was measured using AlphaView Software on an AlphaImager (ProteinSimple, San Leandro, CA). Expression of p12 and p8 were added to give 100% expression. The percent of total Orf-I expression for each clone was graphed. The black bars represent the percentage of p12 expressed and the lighter bar represents the percentage of p8 expressed. The clone is indicated at the bottom of the graph. Expression patterns for each clone were examined in independent transfection experiments where n = 20 for D26, n = 8 for G29S; P45L, n = 7 for P34L/F61L, n = 6 for S69G; S23P; S63P; D26E; P34L, n = 5 for C39R/L40F/R83C; F3L; L66P; Δ5-L6M, n = 4 for R83C, D26N, n = 3 for S91P, n = 2 for R88K; S63P/S91P. The expression patterns could be divided into three groups: p12 and p8, p12 mainly (p12) or p8 mainly (p8). (D) Representative western blot analysis of cell lysates for Orf-I expression, using anti-HA (upper panel) or a loading control (anti-tubulin, lower panel) was performed. Amino acid changes are indicated above each lane. The p12 or p8 isoform is indicated by arrows at the right. (E) Viral DNA levels in PBMCs from individuals with the indicated orf-1 gene expression patterns are indicated in the x-axis. The data obtained was a total of 136 individuals using the same assay (n = 10 individuals with mainly p8 expression, n = 32 individuals with mainly p12 expression and n = 94 individuals with similar p12 and p8 expression) and analyzed by an exact Wilcoxon rank sum test stratified by disease status. The horizontal lines represent the mean viral DNA levels. The open symbols identify healthy carriers and the filled symbols HAM/TSP patients. The statistical significance is indicated by the p value.

