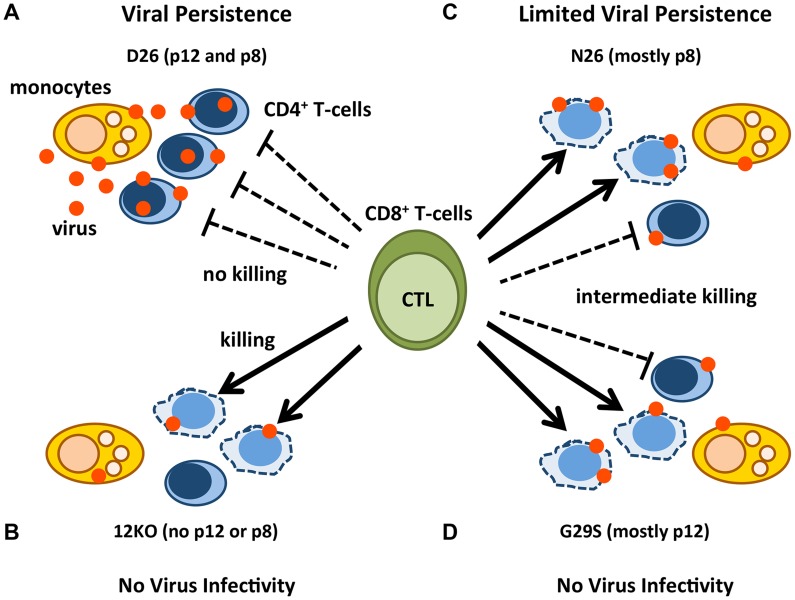
Figure 6. Model of p12 and p8 functions on monocyte, T-cell infection, and their susceptibility to CTL killing.
The red dots represent HTLV-1 virions/proteins and the solid arrows represent effective CTL killing of CD4+-infected T-cells. The dashed lines indicate no CTL killing. Lysed cells are represented by misshapen, dashed lines. Cell types are indicated in the figure. D26-infected CD4+ T-cells expressing balanced levels of p12 and p8 (A); 12KO-infected CD4+ T-cells expressing neither p12 nor p8 (B); N26-infected CD4+ T-cells expressing mainly p8 (C); and G29S-infected CD4+ T-cells expressing mainly p12 (D).

