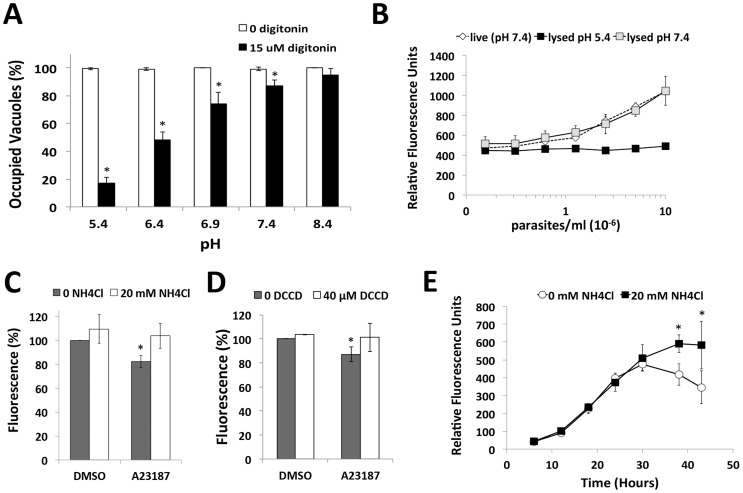
Figure 2. Acidic pH induces parasite egress and pH shifts occur upon egress induction, and late in the replication cycle.
(A) Parasite egress quantified by immunofluorescence microscopy. 30 h vacuoles were treated with high K+ buffer ±15 µM digitonin at 37°C for 3 min prior to fixation and egress enumeration. *p<0.05 vs. pH 8.4 by student's t-test. Graph indicates the average and standard deviation of 3 independent experiments. (B) Superecliptic pHuorin signal is quenched at low pH. HFF cells were inoculated with increasing doses of superecliptic pHluorin expressing plp1ko parasites (plp1kosepH) and fluorescence was observed 30 h post-infection in live cells or cells detergent lysed at pH 5.4 or 7.4. (C, D) A moderate decrease in pH occurs during induced egress. HFF inoculated with plp1ko parasites expressing superecliptic pHluorin for 30 h before treatment with DMSO or A23187 with or without 20 mM NH4Cl (panel C) or 40 µM DCCD (panel D). Results indicate the average and standard deviation of triplicate wells and are representative of 3 independent experiments for NH4Cl and 2 independent experiments for DCCD. * p<0.05 vs. DMSO by student's t-test. (E) pH changes during parasite replication. Fluorescence signal without or with 20 mM NH4Cl was followed for plp1ko expressing superecliptic pHluorin over the course of intracellular replication. The graph indicates the mean and standard deviation of triplicate wells and is representative of two independent experiments with independent clones. * p<0.05 vs. 0 mM NH4Cl by student's t-test.

