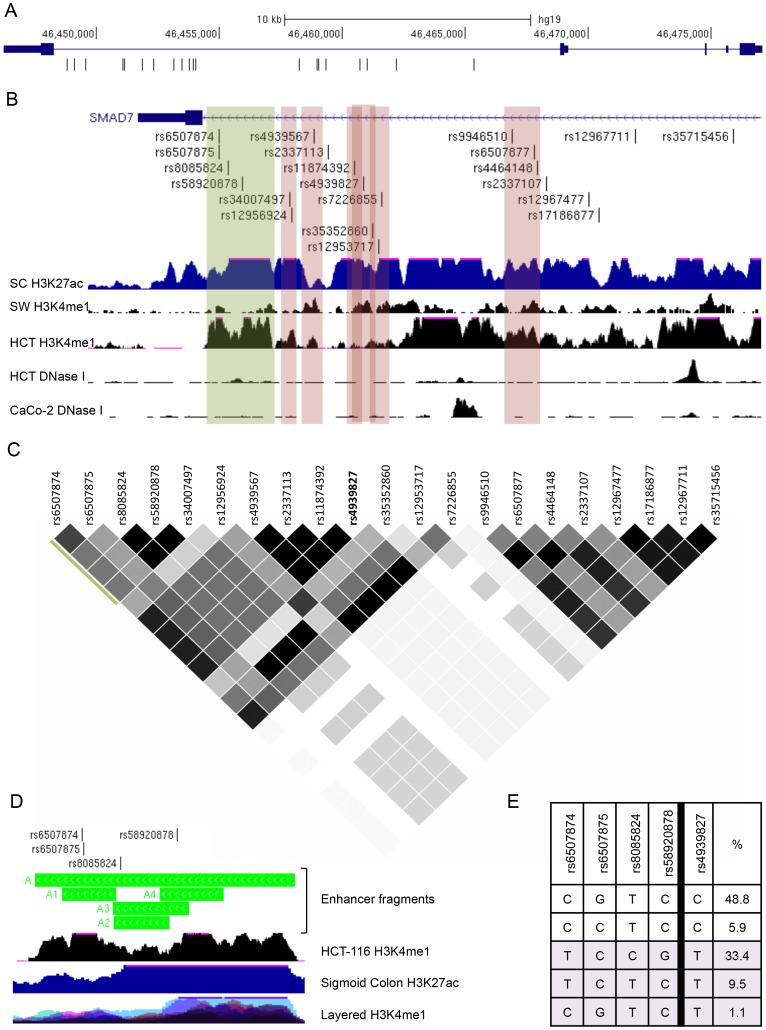
Figure 1. Chromatin features and LD structure for the 18q21.1 CRC GWAS locus.
(A) The SMAD7 gene depicted with genomic coordinates (hg19) and the position of SNPs in LD (r2≥0.2, CEU population) with tagSNP rs4939827. (B) UCSC Genome Browser view of SMAD7 with SNPs in LD with rs4939827 indicated. ChIP-seq tracks for enhancer histone marks are Sigmoid Colon (SC) H3K27ac from REMC/UCSD for the Roadmap Epigenomics Consortium, SW480 (SW) H3K4me1, and HCT-116 (HCT) H3K4me1 from the ENCODE consortium. DNase I hypersensitivity tracks HCT-116 (HCT) and CaCo-2 below are from the UW ENCODE dataset. The green stripe represents the enhancer fragment A. Red stripes indicate cloned fragments B to G (left to right) that were shown to lack enhancer activity. Coordinates for each fragment are provided in File S1. (C) Linkage disequilibrium plot for rs4939827 including all SNPs in 1KG project with r2≥0.2, created with Haploview. r2 = 1- black, 1>r2>0.2 - grey scale. (D) Zoomed view of fragment A showing sub-fragments A1–A4. The ENCODE Layered H3K4me1 track of 7 cell lines is shown to identify cell-type specific peaks. (E) Haplotypes and percentages (CEU population) for the 4 SNPs in fragment A and rs4939827. Haplotypes associated with the rs4939827 risk allele T are in light purple.

