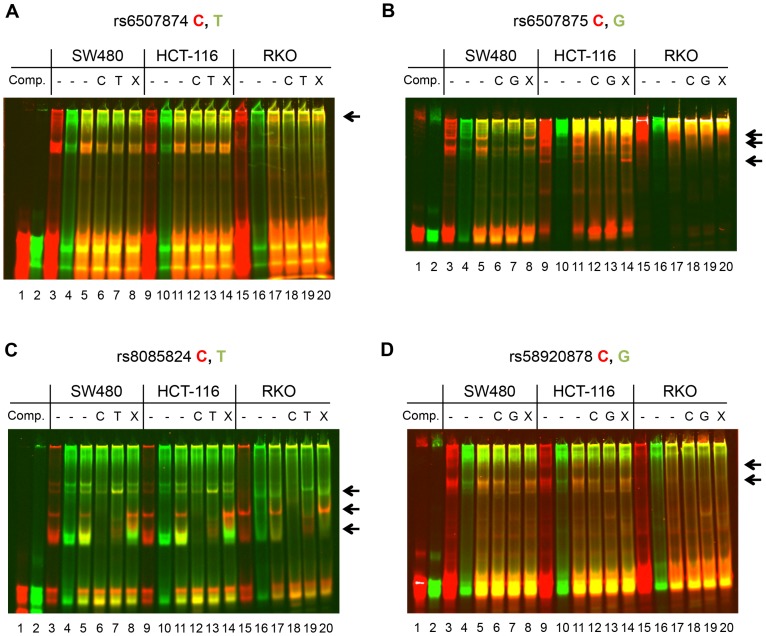
Figure 4. Differential protein binding by SNP alleles using EMSA.
(A) Nuclear extracts from SW480, HCT-116, and RKO cell lines were incubated with IR-dye labeled 33mers centered on rs6507874 C (red label) and T (green labels) prior to native EMSA. Lanes 1 and 2 show probe without nuclear extract. Lanes 3, 4, 9, 10, 15, and 16 show each labeled probe binding to nuclear proteins individually with cell line as noted above. Lanes 5–8, 11–14, and 17–20 are a 1∶1 competition with labeled C and T allele probes. Lanes 6, 12 and 18 contain 200-fold excess unlabeled C allele competitor. Lanes 7, 13, and 19 contain 200-fold excess unlabeled T allele competitor. Lanes 8, 14, and 20 contain 200-fold excess competitor of an unmatching sequence with similar nucleotide content. Bands specific for one allele and lost upon competition are marked with arrows. See Figure S2 for red (700) channel image of the C probe and the green (800) channel of the T probe in black and white. (B) As in panel A, with rs6507875 C allele (red probe) and G allele (green). See Figure S3 for red (700) channel image of the C probe and the green (800) channel of the G probe in black and white. (C) As in panel A, with rs8085824 C allele (red) and T allele (green). See Figure S4 for red (700) channel image of the C probe and the green (800) channel of the T probe in black and white. (D) As in panel A, with rs58920878 C allele (red) and G allele (green). See Figure S5 for red (700) channel image of the C probe and the green (800) channel of the G probe in black and white.

