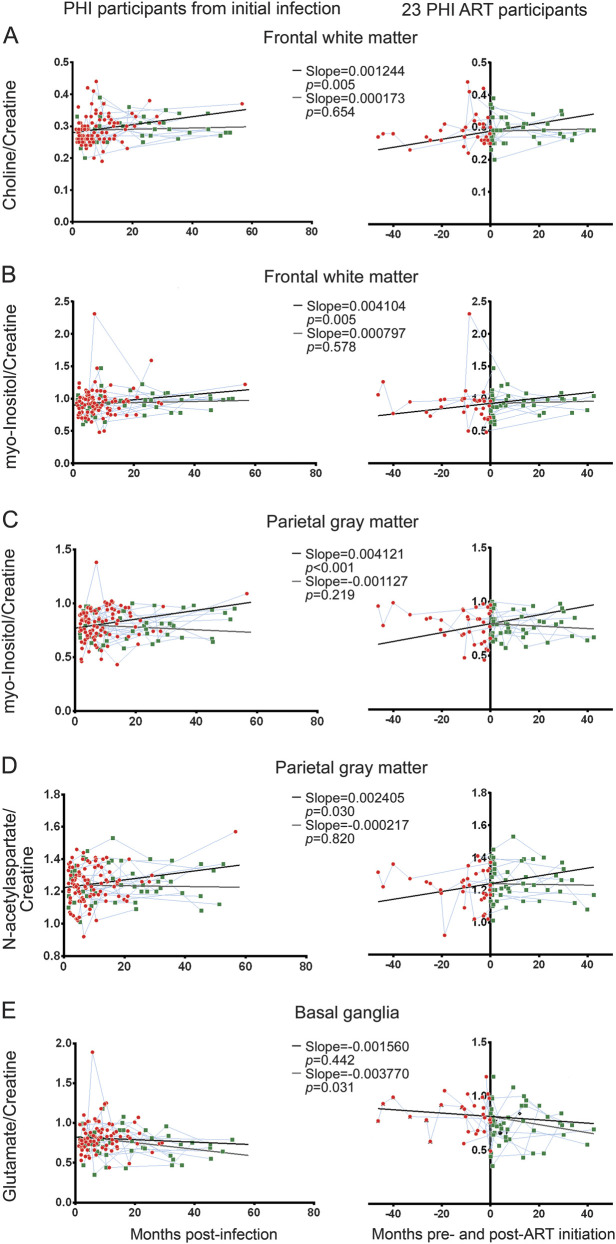
Figure 2. Longitudinal cerebral metabolite ratios and results of linear mixed model analysis.
Left column displays cerebral metabolite measurements in relationship to date of infection for all participants with primary HIV infection (PHI) and the right column displays measurements centered on date of antiretroviral therapy (ART) initiation for 23 ART participants. (A) Choline/creatine ART-naive slopes increase in the frontal white matter. ART-initiated slope is not significantly different from zero. A similar pattern was seen in myo-inositol/creatine in the frontal white matter (B) and parietal gray matter (C). (D) N-acetylaspartate/creatine ART-naive slope increases in the parietal gray matter; ART-initiated slope is not significantly different from zero. (E) Glutamate/creatine ART-naive slope is not significantly different from zero in the basal ganglia. However, ART-initiated slope is significantly negative. For all graphs, red circles represent ART-naive measurements, black lines ART-naive slope, green squares post-ART measurements, and blue lines connect participants' metabolite ratios longitudinally. Gray lines represent ART-initiated slope beginning at 6.4 months (median time of ART initiation) in the left column and begin at 0.0 months in the right column.

