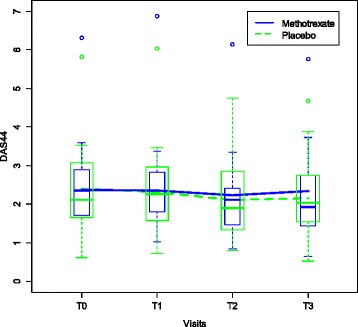
Figure 3.

Evolution in disease activity. Displays the evolution of the disease activity as measured by the disease activity score based on 23 joints (DAS28) while receiving either methotrexate (MTX) (N = 25) or placebo (PBO) (N = 21). This figure aggregates both treatment periods, before and after the crossover.
