Figure 3.

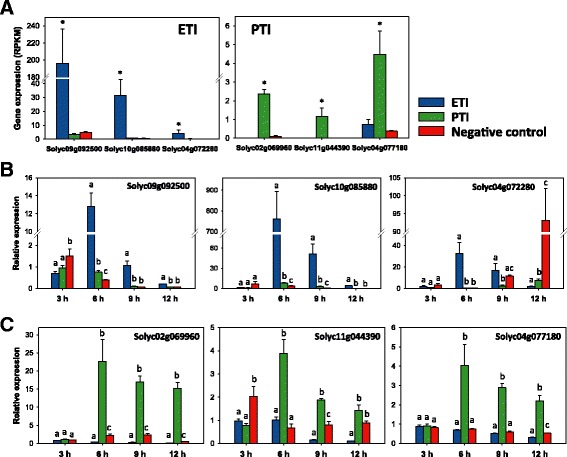
Development of Pto/Prf-mediated ETI and flagellin-activated PTI reporter genes. (A) Transcript abundance (RPKM) of selected reporter genes in RG-PtoR at 6 hai with DC3000 strains as in Figure 1. Asterisks indicate significant differences (P <0.05) with raw P-values corrected for multiple testing using the false discovery rate. (B,C) Relative expression (based on quantitative RT-PCR) of ETI- (B) and PTI-reporter genes (C) at different time points after inoculation with DC3000 strains as in Figure 1 to induce ETI or PTI. SlATPase was used as the reference gene for quantitative RT-PCR; similar results were obtained using SlCBL1 (Calcineurin B-like protein) and SlEF1α. Bars represent the mean of four biological replicates with their corresponding standard error. Different letters indicate significant differences at the same time point using Tukey’s HSD test (P <0.01). RPKM, reads per kilobase per million of mapped reads.
