
Figure 4.
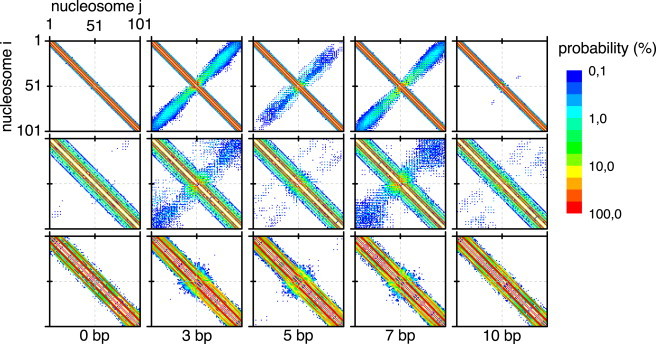
Nucleosomal contact maps of the CL, CLS, and ID fiber (top, center, and bottom row, respectively) for a subset of nucleosomal displacements (bottom). Each map shows the contact probabilities of distinct pairs of nucleosomes i and j. The repositioned nucleosome is located at index 51. The probability is expressed as a percentage. Note the logarithmic probability scale, with white meaning a probability <0.1. The region of the diagonal from top left to bottom right shows the interactions between each nucleosome and its direct neighbors, and the region around the antidiagonal shows interactions between nucleosomes that reside in distant sites of the fiber. To see this figure in color, go online.