
Figure 6.
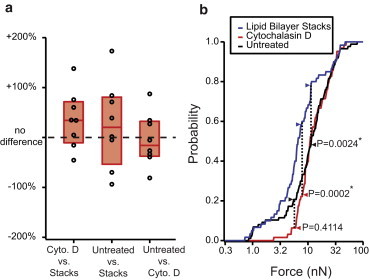
Comparing breakthrough forces between bilayer types. (a) Pairwise differences between median breakthrough forces in stacks, untreated HEK cells, and cytochalasin D-treated HEK cells. Each point represents the median breakthrough force from all experiments done with a different nanoneedle probe. Boxplots represent median and quartiles of median breakthrough forces from the eight probes. No significant difference was found by paired t-test between the mean of medians for any two bilayer types. (b) Cumulative probability histogram for all breakthrough forces and KS test. The untreated and cytochalasin D-treated cells are statistically indistinguishable from one another (Ne = 35.6, D = 0.1434, p = 0.41). The lipid stacks differed from both the untreated cells (Ne = 35.5, D = 0.3778, p = 0.0024) and treated cells (Ne = 30.7, D = 0.3006, p = 0.0002). To see this figure in color, go online.