
Figure 1.
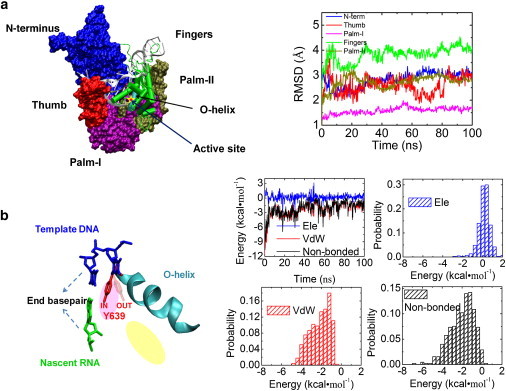
MD simulation on T7 RNAP at the posttranslocated state. (a) (Left) A structure of T7 RNAP elongation complex. (Silver) Nucleic acids. Each protein subdomain is colored differently. (Blue) N-terminus (residues 1∼325); (red) thumb (326∼411); (purple) palm-I (412∼553); (green) fingers (554∼784); (brown) palm-II (785∼883). (Right) The RMSD values of the protein subdomains with corresponding colors. The active site (yellow star) for the nucleotide addition is located on the palm-I subdomain. The O-helix (cyan) on the fingers subdomain close to the active site is also indicated. (b) (Left) The stacking of Tyr639 (red) to the end bp of the DNA-RNA hybrid (blue and green) in cartoon representation. Tyr639 locates on the C-terminal of the O-helix, with its side chain inserted in the active site (pink oval) and close to the preinsertion site (yellow oval). (Right) The interaction energy between Tyr639 and the end bp. The nonbonded interaction energies (black) between Tyr639 and the end bp, along with the electrostatic (ele) (blue) and vdW (red) contributions, are shown in time series (from the 100-ns simulation) and histograms (measured −2.0 ± 1.2 kcal/mol for nonbonded, 0.2 ± 0.6 kcal/mol ele, and −2.2 ± 1.0 kcal/mol vdW).