
Figure 6.
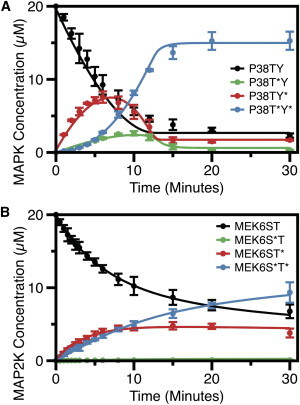
Time courses of MAPK cascade phosphorylation reactions in Humphreys et al. (16). (A) The time-course for phosphorylation of p38 MAPK by MEK6 was generated from mass-spectrometric data and then fit to a set of elemental differential equations in the software DYNAFIT (BioKin, Watertown, MA; http://www.biokin.com/dynafit/) (73). A Monte Carlo method is then employed to estimate errors associated with individual parameters and eliminate those that are poorly constrained. (B) The time course of the phosphorylation of MEK6 by ASK1, as above. Data reprinted with permission (16). To see this figure in color, go online.