
Figure 3.
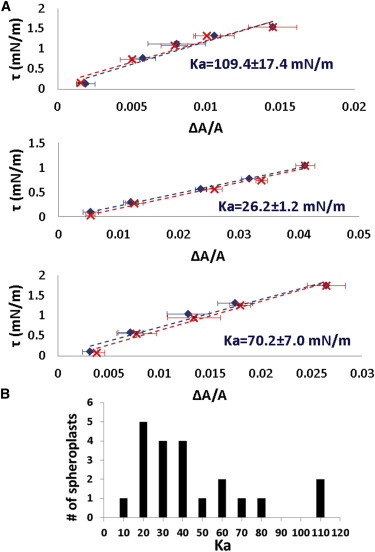
(A) Three examples of reversible tension τ versus fractional area change of spheroplast membranes. In each example blue data are for increasing tension and red for decreasing tension. The data points are equilibrium values. The error bars represent the uncertainties in calculating the area from the microscope images. The uncertainties in tension calculation are smaller than the data symbols. , the apparent stretching modulus, was measured from the slope of each curve. (B) of a spheroplast population in 28% STOP solution. To see this figure in color, go online.