
Figure 2.
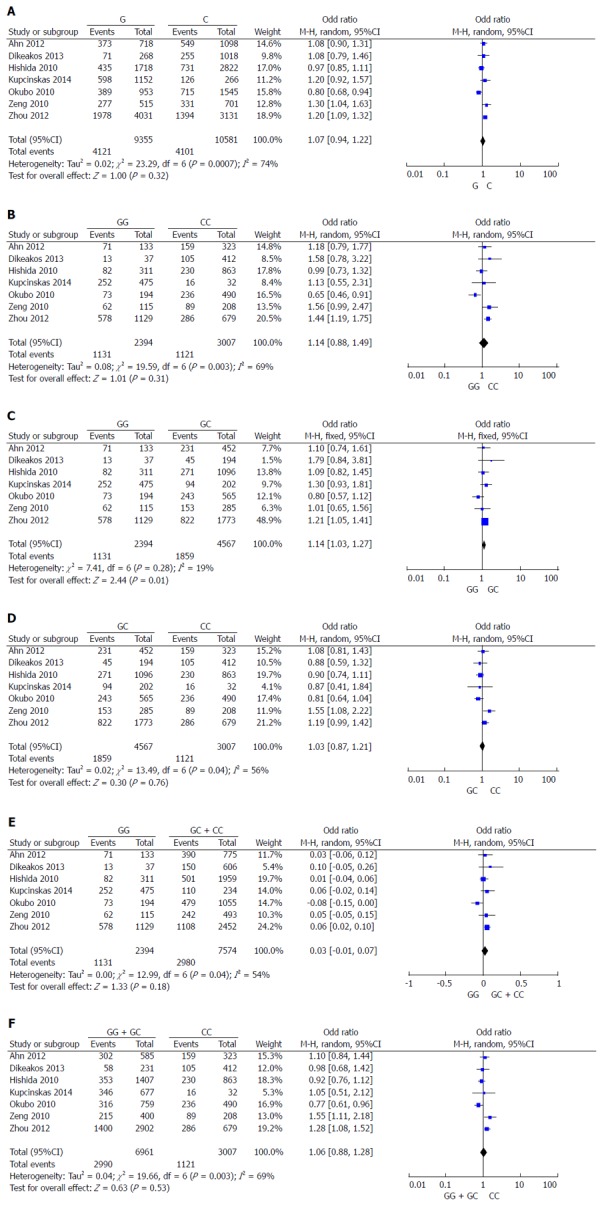
Forest plots of odds ratios for the association of the mir-146a G/C polymorphism with risk of gastric cancer in overall analyses. A: G vs C; B: GG vs. CC; C: GG vs GC; D: GC vs CC; E: GG vs GC + CC; F: GG + GC vs CC.
Official websites use .gov
A
.gov website belongs to an official
government organization in the United States.
Secure .gov websites use HTTPS
A lock (
) or https:// means you've safely
connected to the .gov website. Share sensitive
information only on official, secure websites.
Forest plots of odds ratios for the association of the mir-146a G/C polymorphism with risk of gastric cancer in overall analyses. A: G vs C; B: GG vs. CC; C: GG vs GC; D: GC vs CC; E: GG vs GC + CC; F: GG + GC vs CC.