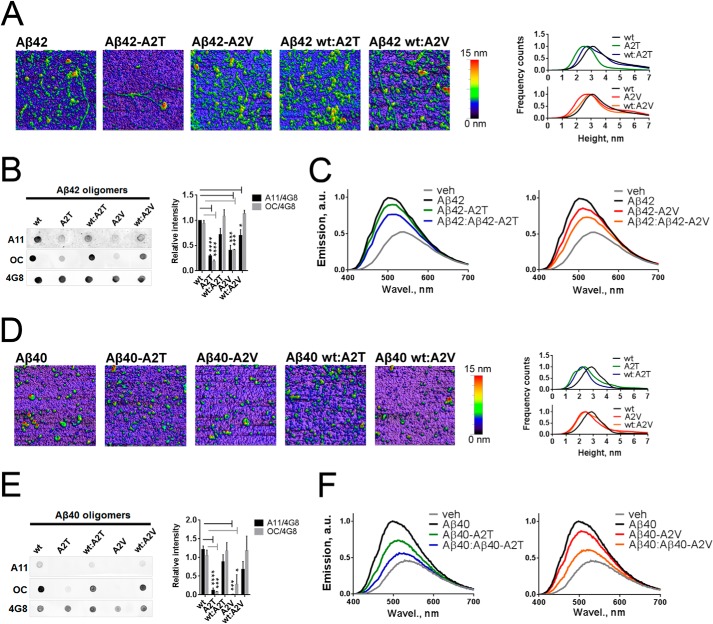
FIGURE 6.
Effect of the A2T and A2V mutations on morphology, immune reactivity, and hydrophobic exposure of Aβ42 and Aβ40 oligomers. A, atomic force micrographs of pre-aggregated Aβ42 mutants and their equimolar mixes with the wild type Aβ42. Images are obtained in the tapping mode under ambient conditions. On the right, Aβ42 oligomer size histograms obtained via the multiple Gaussian distribution fit of particle height. The peak height is 3.1 nm for WT Aβ42, 2.49 nm for Aβ40-A2T, 2.76 nm for Aβ40-A2V, 2.72 nm for Aβ40/Aβ40-A2T, and 2.9 nm for Aβ40/Aβ40-A2V. B, immune dot blot of Aβ42. Aβ was incubated in Tris/EDTA buffer, pH 7.4, for 2 h, blotted on a nitrocellulose membrane, and probed with conformation-specific antibodies A11 and OC. 4G8 antibody, which reacts with all Aβ forms, was used as a loading control. Right panel, densitometric analysis of Aβ42 dot blots. A11 and OC reactivity of mutant aggregates are significantly diminished compared with WT aggregates (unpaired two-tailed t test; *, p < 0.05; ***, p < 0.001; ****, p < 0.0001, means+ S.E., n = 4). C, normalized fluorescent spectra of 8-anilinonaphthalene-1-sulfonate (ANS) dye upon its binding to pre-aggregated Aβ42 mutants and their 1:1 mixes with the wild type peptide. A mean value from n = 2 in duplicate is plotted. Increased magnitude and blue shifting of ANS spectra are indicative of increased hydrophobicity of the ANS-bound entities. D, atomic force micrographs of pre-aggregated Aβ40 mutants and their equimolar mixes with the wild type Aβ40. Images are obtained in the tapping mode under ambient conditions. On the right: Aβ40 oligomer size histograms obtained via the multiple Gaussian distribution fit of particle height. The peak height is as follows: 2.87 nm for WT Aβ40, 2.38 nm for Aβ40-A2T, 2.43 nm for Aβ40-A2V, 2.19 nm for Aβ40/Aβ40-A2T, and 2.47 nm for Aβ40/Aβ40-A2V. E, immune dot blot of Aβ40. Aβ was incubated in Tris/EDTA buffer, pH 7.4, for 2 h, blotted on a nitrocellulose membrane, and probed with A11 and OC antibodies. 4G8 antibody was used as a loading control. Right panel: densitometric analysis of Aβ40 dot blots. A11 and OC reactivities of mutant aggregates are significantly diminished compared with WT aggregates (unpaired two-tailed t test; *, p < 0.05; ***, p < 0.001; ****, p < 0.0001, means + S.E., n = 4). F, normalized fluorescent spectra of the ANS dye upon its binding to pre-aggregated Aβ40 mutants and their 1:1 mixes with the wild type peptide. A mean value from n = 2 in duplicate is plotted. veh, vehicle; a.u., arbitrary units; Wavel, wave length.

