
FIGURE 2.
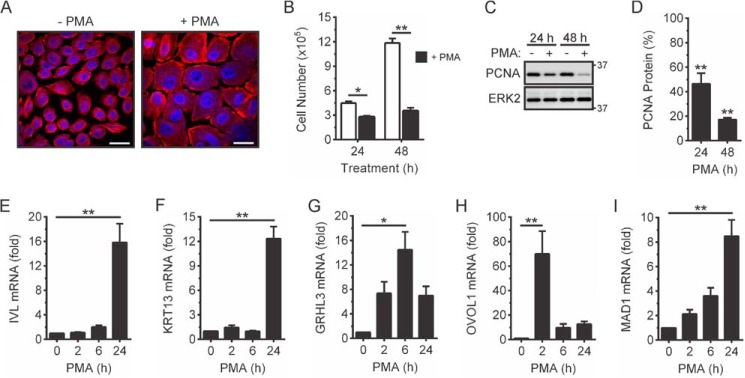
PMA-inducible OKF6 cell differentiation. A–D, OKF6 cells were cultured in the presence of 100 ng/ml PMA or 0.1% DMSO vehicle for up to 48 h. A, the cells were fixed 48 h post-treatment and stained with an anti-β-tubulin antibody (red), and nuclei were stained with DAPI (blue). Scale bars = 20 μm. B, the viable cell number was enumerated by cell counting. *, p < 0.05; **, p < 0.01. C and D, cell lysates were subjected to Western blotting with anti-PCNA and anti-ERK2 (loading control) antibodies (C). The positions of molecular weight standards (in kilodaltons) are indicated. D, PCNA protein levels in DMSO-treated cells in C were given an arbitrary value of 100%. **, p < 0.01. E–I, OKF6 cells were treated with 100 ng/ml PMA or 0.1% DMSO for the indicated times. IVL (E), KRT13 (F), GRHL3 (G), OVOL1 (H), and MAD1 (I) mRNA levels were measured by real-time PCR and are shown as the fold increase relative to DMSO-treated cells. *, p < 0.05; **, p < 0.01. All graphical data are combined from three independent experiments.