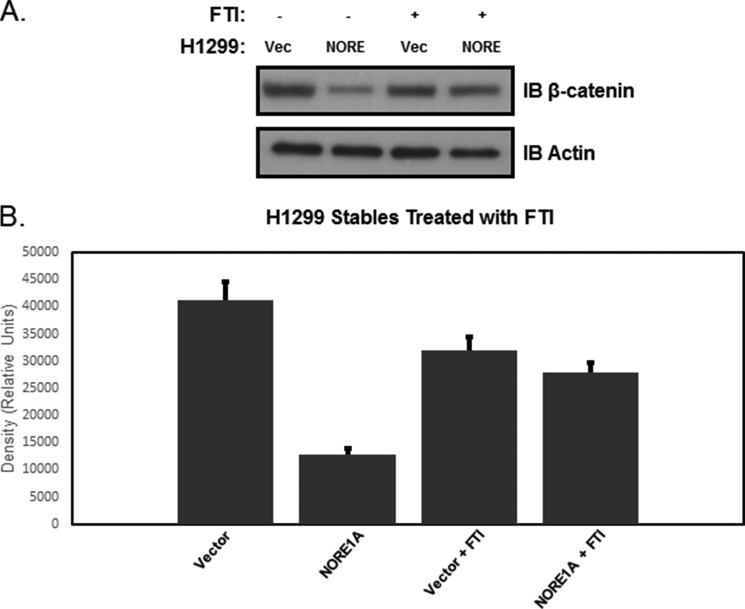
FIGURE 7.
A, NCI-H1299 cells stably transfected with NORE1A or empty vector (Vec) were treated with a farnesyl transferase inhibitor for 24 h to modulate Ras. Whole cell lysates were harvested and probed for total levels of endogenous β-catenin. A representative blot is shown. B, quantification of two experiments. Vector, Ras+/NORE1A−; NORE1A, Ras+/NORE1A+; Vector + FTI, Ras−/NORE1A−; NORE1A + FTI, Ras−/NORE1A+. A normal cell would be expected to be negative for activated Ras and positive for NORE1A. Therefore, the fourth column is the reference column. Quantification using densitometry was calculated on QuantityOne software from Bio-Rad. Values from two separate assays were combined for quantification. The graph shows these data as mean ± S.E. (p = 0.02).

