
FIGURE 5.
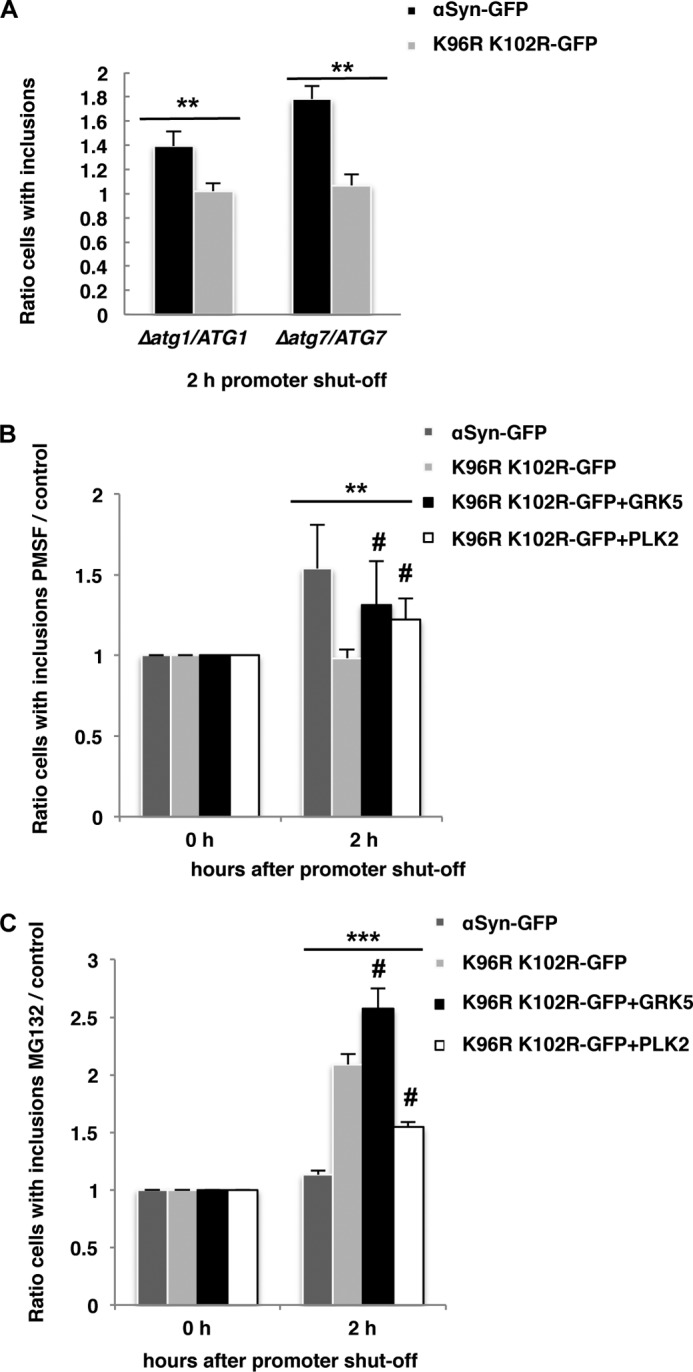
αSyn aggregate clearance upon promoter shutoff. A, inhibition of autophagy by deletion of ATG1 and ATG7. Expression of αSyn-GFP and K96R/K102R-GFP was induced for 4 h in galactose medium and then the cells were shifted to glucose medium. Quantification of the reduction of inclusions was done 2 h after the promoter shutoff and was presented as the ratio of aggregate clearance in the deletion strain to aggregate clearance in the isogenic wild-type strain. Significance of differences was calculated with t test (**, p < 0.01, n = 3). B, inhibition of the vacuolar degradation pathway by PMSF. Quantification was of cells expressing αSyn-GFP, K96R/K102R-GFP, and K96R/K102R-GFP and co-expressing GRK5 or PLK2, respectively. αSyn-GFP and K96R/K102R-GFP were expressed from two genomically integrated copies. After 4 h of induction of the protein expression in galactose medium, cells were shifted to glucose medium supplemented with 1 mm PMSF dissolved in ethanol (EtOH) or only EtOH as a control. Quantification of the reduction of inclusions was done 2 h after the promoter shutoff. Cells with inclusions were counted and presented as a ratio to the control (EtOH). C, inhibition of the proteasome with MG132. The protein expression was induced as above, and the cells were shifted to glucose medium supplemented with 75 μm MG132 and dissolved in DMSO or only DMSO as a control. Quantification of the reduction of inclusions was done 2 h after the promoter shutoff. Cells with inclusions were counted and presented as a ratio to the control (DMSO). Significance of differences was calculated with one-way ANOVA with Bonferroni's multiple comparison test (**, p < 0.01; ***, p < 0.001; n = 3; #, p < 0.05 versus K96R/K102R-GFP) (Bonferroni's multiple comparison test).