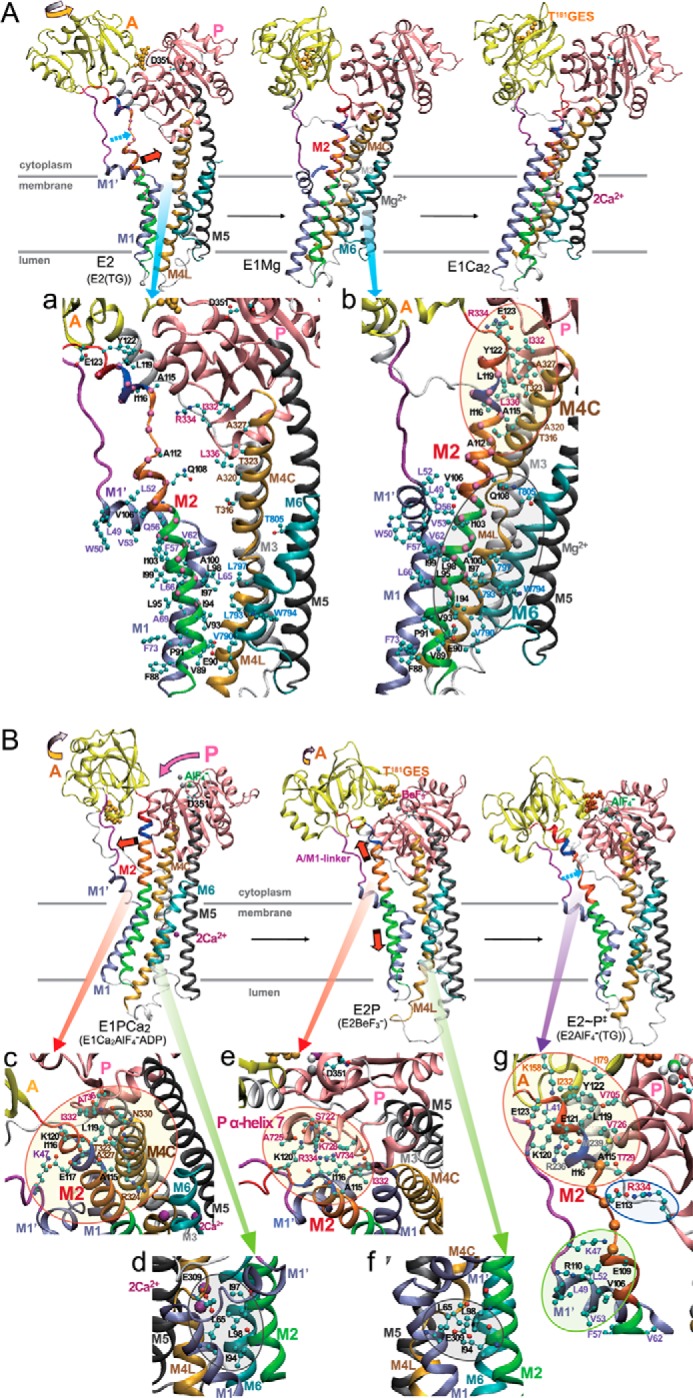
FIGURE 10.

Detailed inspection of structure and interactions of M2 in crystal structures. The structural changes are modeled as in Fig. 1A. The N domain and M7–M10 helices are not depicted for simplicity. The red (A and B), ice blue (A), yellow (A and B), and pink (B) arrows indicate the approximate motions of M2, M1′, A domain, and P domain, respectively. The broken light blue arrow (A and B) indicates the unwound part of M2. The TGES184 loop is depicted with orange van der Waals spheres. Interactions involving M2 regions are shown in transparent circles in enlarged views. See “Discussion” for the details and the roles of M2 regions.
