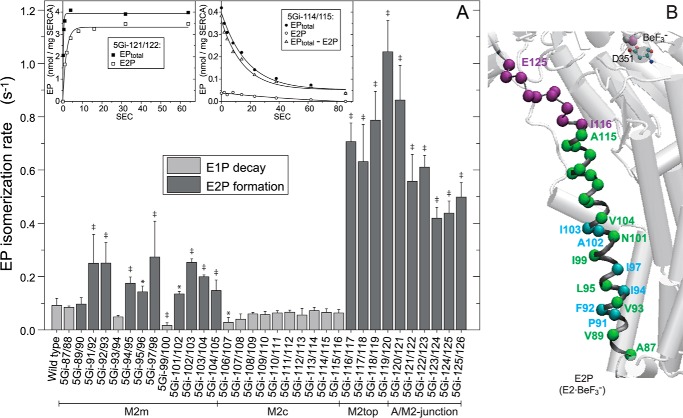
FIGURE 5.
EP isomerization rate. A, for the wild type and mutants that accumulate mostly E1P at steady state (E2P less than 30% of EPtotal; cf. Fig. 4), the E1P to E2P isomerization rate was determined by E1P decay kinetics, which represent the rate-limiting E1P to E2P isomerization (mutant 5Gi-114/115 (right inset) is a typical example). Here, the Ca2+-ATPase was first phosphorylated with [γ-32P]ATP at 0 °C for 1 min as in Fig. 4; phosphorylation was terminated by Ca2+ removal and the addition of an equal volume of a buffer containing 10 mm EGTA, 0.1 m KCl, 7 mm MgCl2, and 50 mm MOPS/Tris (pH 7.0) at 0 °C; and the amounts of EPtotal and E2P were determined at the indicated times. The amount of E1P was calculated by subtracting E2P from EPtotal (EPtotal − E2P). Solid lines show the least squares fit to a single exponential, and the E1P decay rates thus obtained are shown in the main panel (light gray bar). For the mutants that accumulate E2P more than 30% of EPtotal (cf. Fig. 4), the EP isomerization rate was determined as the apparent rate of E2P formation from E1P to reach steady state as follows (mutant 5Gi-121/122 (left inset) is a typical example). Here, the Ca2+-ATPase was phosphorylated for the indicated periods after ATP addition, and the amounts of EPtotal and E2P were determined; otherwise, conditions were as described above. The formation of EP (EPtotal, representing E1PCa2 formation from E1Ca2) was very fast (reaching a steady state within ∼1 s) and was followed by E2P formation from E1PCa2. Solid lines show the least squares fit to a single exponential, and the apparent rates of E2P formation are shown in the main panel (dark gray bar). Statistical significance compared with the wild type is shown: *, p < 0.05; ‡, p < 0.01. B, the mutation effects of residues in A are visualized with α-carbon coloring: green, transition rate less than 0.15 s−1 (almost no effect or only a slight effect); light blue, 0.15–0.3 s−1 (moderate acceleration); purple, higher than 0.3 s−1 (marked acceleration). Error bars, S.D.

